“The views expressed are those of the author and do not necessarily represent those of the National Weather Service.”
Please keep in mind the ESRL/PSD GSDM web link, below, while reading this discussion.
http://www.cdc.noaa.gov/map/clim/gsdm.composites.shtml
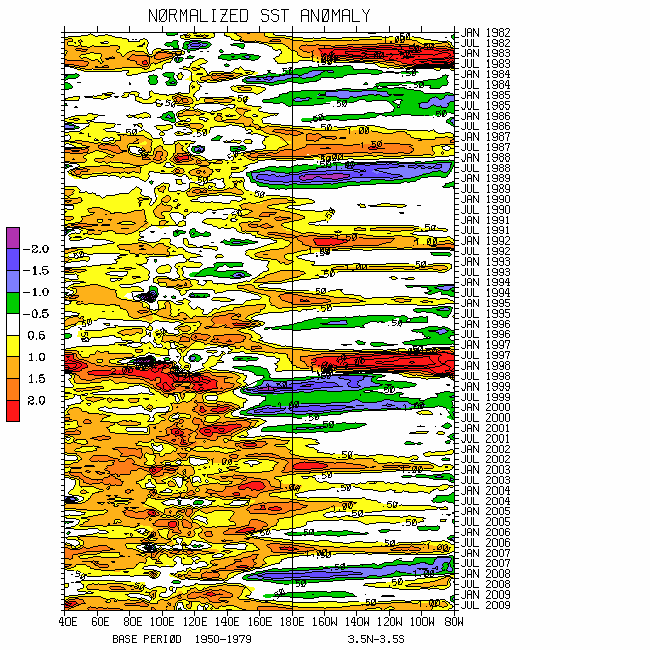
Please see links below for global SST details. For the first time perhaps in more than a year, the warmest SSTs globally during the past week have been centered in the equatorial and North Indian Ocean (~5-10N/60-90E). Totals have been in excess of 30C with anomalies generally greater than plus 1C. Persistent convective suppression (until recently; discussed below) and possibly the seasonal cycle are contributing. Anomalously warm SST “pockets” have also been developing northwest of Australia and eastern Indonesia. Intense-severe tropical convective forcing focused around 10-20S/180-160W has cooled the South Pacific Ocean.
Finally, recent weak surface westerly wind flow anomalies have continued to moderate the cool Nino SSTs. SST anomalies ~minus 0.5-1C are still hanging around 140-160W in the equatorial East Pacific, with even shallow positive anomalies of similar magnitude appearing west of South America. Substantial warmth is present at depth along the equatorial thermocline west of 160W at ~100-200m per latest 5-day averaged TAO buoy data. Magnitudes are around plus 2-4C.
While only a few scientific matters can be discussed in this forum, there are several very serious weather-climate monitoring issues that attention must be paid to heading into boreal summer. These include warming of the west Pacific Ocean should westerly wind bursts (WWBs) start to occur on the equator, while atmospheric dynamical processes stubbornly try to maintain La-Nina. In the following, I am again challenged to write about exceptionally complicated and somewhat conflicting signals.
http://www.wmo.int/pages/prog/wcp/wcasp/enso_update_latest.html
http://iri.columbia.edu/climate/ENSO/currentinfo/technical.html
http://www.pmel.noaa.gov/tao/jsdisplay/
http://www.cdc.noaa.gov/forecast1/IndoPacific.frcst.html (note the initial projection)
http://www.cpc.ncep.noaa.gov/products/precip/CWlink/MJO/index.primjo.html (link 19)
http://www.cdc.noaa.gov/map/images/sst/sst.long.time.io.gif
On face value, the strongest subseasonal atmospheric signal is the MJO. Through 3 April phase space plots employing the WH (2004) MJO measure show approximately a 2.5 sigma projection in octant 1. This is real; however, it was forced by extratropical dynamics including fast subtropical wave trains (SWT)/baroclinic wave packets (BWP) that are considered by the WB (2009) measure of the GWO. I do not want to get into details, especially when they are still in the realm of research. The point is that this MJO is a wind driven event (loosely), and perhaps analogous to a cheap non-mesocyclone EF-1 tornado that occurs when a low LCL shallow rain shower crosses a surface boundary embedded in intense shear. What are the average warning lead times for those? In any case, for forecasting purposes, it is appropriate to “play this MJO card”, for the time being.
Nevertheless, somewhat similar to December 2008, this dynamical tropical convective signal literally grew out of the noise (no SSW this time), and that is one reason why the MJO snr composite anomaly plots for 250mb psi do not accurately depict the current tropics and extratropics very well. In other words, non-oscillatory decay time scale processes (stochastic) explained by the WB (2009) measure of the GWO as opposed to truly quasi-oscillatory subseasonal tropical convective variability resulted in what the "rest of the world" now considers to be a MJO. Typically, MJOs originate around the African/Indian Ocean regions, compared to Indonesia as was observed early March 2009 and late December 2008. I submit those who take the time to understand these kinds of issues scientifically will have a better understanding of subseasonal matters/global atmospheric dynamics including making predictions (on average), than those who just use numerical model forecasts as a stand alone.
Full disk satellite imagery and other diagnostic tools clearly indicate that the strongest tropical convective forcing has been focused across the South Pacific Ocean (~15S/165W) for about the past week or so. Other tropical forcing has been occurring in the regions of tropical South America and equatorial Africa. This spatial pattern of approximately 3 centers of enhanced rainfall is a characteristic of a Western Hemisphere MJO signal.
Tying back into the monitoring issues, Hovmoller plots of OLRA have shown a slow eastward shift of tropical forcing across the southern tropics (2.5-15S) since roughly November 2008 from ~120E to 165W. The recently observed South Pacific Ocean forcing appears to be the most intense in at least a year. Broad brushing details, on interannual time scales, perhaps we are observing the most significant perturbation on what has been an extremely stubborn La-Nina base state. A respectable WWB did occur south of equator (~10m/s anomalies), and there have been a few tropical cyclone spin-ups (including Lin). Is this an indication that there will be a resumption of REAL MJOs (or coherently eastward shifting modes) leading to WWBs on the equator? Stay tuned. Perhaps we are starting to observe a forcing-response-feedback process involving the weather-climate dynamical system, and (state dependent multiplicative?) noise events leading to “cheap MJOs” during La-Nina are part of that.
Tropical convective forcing appears to be waning across the South Pacific, while slowly increasing across the warm Indian Ocean. In fact, tropical convection may be getting concentrated in the region of 90-120E. Most forecast tools do suggest convection to continue intensifying in this region during the next 2-3 weeks. Albeit shifted poleward (~35N/35S), zonal mean upper tropospheric easterly wind flow anomalies have been strengthening again, recently ~5m/s at 250mb. Global relative AAM has decreased to near 1.5 sigma below the R1 data climatology (through 1 April), and there is improving meridional symmetry of interhemispheric zonal mean zonal wind anomalies including the easterlies. Bottom line, our La-Nina base state is re-intensifying, at least for now.
On a more regional scale, and I do think this is a feedback from the South Pacific signal, while the global mountain torque is nearly zero, the East Asian component is strongly positive, ~plus 30 Hadleys. If updated today, I suspect the latter is already collapsing. That has contributed to a positive AAM tendency of ~plus 20 Hadleys forcing the WB (2009) measure of the GWO to orbit into octants 3-4 of phase space (shifted toward La-Nina). From various animations I can already see evidence that the EAJ will extend (shifted somewhat south) as a response leading to split flow across North America by week-2. Most models do show this. However, I also think this jet will collapse leading to initially “cutoff lows” across the Desert Southwest, followed by stronger and energetic baroclinically amplifying progressive full latitude western and central USA troughs. The latter may be probable late week-2 into week-3. The models are likely to struggle with the latter.
Overall, any subseasonal outlook this time of year has higher uncertainty. Our current situation is adding to it. That “excuse” typed, I think the GWO snr plots of 250mb psi (and other variables) composite anomalies for phases 4-5 week-1 then 7-8-1 week-2 are probable. Phases 2-3 may become more persistent weeks 3-4, possibly linearly superimposing upon the MJO snr composite anomaly plots of 250mb psi for phases 4-5 (in the WB (2007) GSDM sense). The latter is essentially La-Nina. Will that situation persist afterward? Stay tuned.
After a bit of a respite next week, much of the Rockies and Plains may experience exceptionally active weather again week-2, perhaps including precipitation opportunities for the southern High Plains. Should we go back to a northward shifted but energetic storm track starting week-3, drought may intensify across the southern USA once again. Other weather ramifications, nationally and internationally, should be understood.
Appendix
All presentations from the 24 February 2009 GWO workshop are available via anonymous ftp. If you have not received information on how to retrieve these, let me know. There was excellent attendance at this day-long event, and feedback was strongly positive. We appreciate all the support!
Links to CPC and PSD ENSO discussions, and a new experimental forecast technique involving a coupled LIM (3rd link below):
http://www.cpc.ncep.noaa.gov/products/analysis_monitoring/enso_advisory/index.shtml
http://www.cdc.noaa.gov/people/klaus.wolter/MEI/
http://www.cdc.noaa.gov/forecasts/clim/
The following are links to information about the stratosphere and other nice monitoring tools:
http://ds.data.jma.go.jp/tcc/tcc/products/clisys/index.html
http://code916.gsfc.nasa.gov/Data_services/met/ann_data.html (new stratosphere link!)
The following is a link to NCEP model verifications (surf around for lots more):
http://www.cpc.ncep.noaa.gov/schemm/z500ac_wk2_na.html
The following is a link discussing recent global weather and related events:
http://www.wmo.ch/pages/mediacentre/news/index_en.html
These are probabilistic statements. We hope that an opportunity will arise for us (soon) to allow our dedicated web page effort to mature, expediting objectively and accountability. This web page effort will hopefully include an objective predictive scheme for the GWO with hindcasts.
The WB (2007) paper on the GSDM has been published in the February issue of MWR. The first of a two-part paper, where WB formally introduce the GWO (WB (2009)), is (still) awaiting publication in MWR. An early on-line release can be downloaded from the following link:
http://ams.allenpress.com/archive/1520-0493/preprint/2008/pdf/10.1175_2008MWR2686.1.pdf
In addition to the subseasonal snr composite anomaly plots, we would like near real-time discussions with “weather maps” to become a routine part of the ESRL/PSD GSDM web site sometime soon. Part-2 of our GWO paper will discuss the latter. We want to emphasize notions such as global-zonal mean-regional scale linkages as well as forcing-response-feedback (with subsequent interactions) relationships. An important purpose is to provide a dynamical weather-climate linkage framework to evaluate the numerical models in a sophisticated manner as part of a subseasonal (and any time scale) forecast process, in addition to a climate service for all users. Relying on the numerical models alone is a cookbook, extremely unscientific, and makes the Rottweiler VERY angry! I am planning on posting a discussion next weekend, 10-12 April.
Ed Berry
7 comments:
Hi Ed.
I remain a faithful and enthusiastic and faintly overwhelmed reader.
Here is a link to a worthwhile video regarding the recent SSW:
http://www.youtube.com/watch?v=gXnSOQBv8XI&NR=1
Best,
Harold
Hello Harold,
Thank you for the support, and the link! Very interesting. However, that SSW was most likely caused by "meteorological" reasons. For example, EP fluxes at 100mb were strongly upward centered ~55N after the strong PNA forced by late December-January MJO (see link).
http://ds.data.jma.go.jp/tcc/tcc/products/clisys/STRAT/html_e/tlat_epz_12z_nh.html
Take care,
Ed
Hi Ed.
If I understand you correctly you're saying both of the following things:
1. The timing of the space weather event and the ssw was a coincidence.
2. The event could not have a discernible effect on the atmosphere.
Is that right?
The link you gave was cut off -- try again?
Harold
Hi Harold,
I just cut and pasted the link again. Hopefully it will work. It is possible the site was down.
http://ds.data.jma.go.jp/tcc/tcc/products/clisys/STRAT/html_e/tlat_epz_12z_nh.html
All I am suggesting is that there is a meteorological reason for the ssw based on past scientifically defensible work. How coincidental this was with the space weather event, including impacts on the earth's atmosphere, is unclear to me. The YouTube video you sent me did not seem to scientifically justify its proposed claims.
I apologize if you do not like this response. However,we need to be objective, which is especially challenging with the nature of the weather-climate work we do.
Ed
We seem to be in a very interesting time. We are blessed to witness climatic cycles through the lens of copious amounts and data.
Do you think that conflicting signals regarding the continuing base La Nina circulation and rumblings of a change are based on a struggle to change from a 'Top Down' (Atmospheric circulation dictates Oceanic SST anomalies) to a 'Bottom Up'?
No doubt that a Blockbuster Winter in the East, particularly the Southeast, would cause a great deal of excitement. Of bigger concern is the rising number of un and underemployed who would need early warning of further extremes in the climate.
Hopefully another false Summer 'El Nino' will not sucker the meteorological community into believing the La Nina circulation pattern is resolved until key evidence supports the idea.
This article was excellent. I got a good laugh from the title.
Dean
Hi Ed,
I like the title of your latest blog entry.
In looking at the latest ENSO/EL NINO analysis that the equitorial subsurface temperatures appear to be creeping eastward at this time. While I think this happened last year at the time of seasonal transition, I see that they are a bit deeper and perhaps one could argue further east than last year which make me wonder if something is "changing" finally. I also noticed that the SST anomaly forecast (frame 28)for Pacific basin is for at least a weak El Nino with weakly positive anomalies in the central and eastern equitorial Pacific.
http://www.cpc.noaa.gov/products/analysis_monitoring/lanina/enso_evolution-status-fcsts-web.pdf
My feeling on this if it were to come true, is that if convection were to initialize in these areas (enhanced subtropical jet) by at least late summer for northern hemisphere, this may potentially bring a better chance for above normal precipitation for the southwest including California and Nevada, most importantly for the Sierra going into the next cold season. While I know its much to early to forecast the weather for the next cold Boreal season, one has to think this may be plausible especially give the length of time of above normal SST forecast in the presentation.
On another note, I have read many times with the atmosphere in a "La Nina" base state, as is the case now, during the summer in the northern hemisphere, the southwestern monsoon typically is amplified with above normal thunderstorm activity extending into California and especially the Sierra. Is that your opinion as well? I have seen it go either way but no real trend for sure.
I'm not looking forward to a big fire season is all.
Many thanks.
Robert
Hello Dean and Robert,
Thank you for the wonderful comments! I will try to respond to both of you with the following.
I think the key messages include high uncertainty with ENSO, and we need to diligently monitor. There has been a tendency for strong ENSO events to occur in "3s". Currently, there has been some warming of the East Pacific (similar to a year ago), and some deepening of the oceanic thermocline has occurred across the western equatorial Pacific Ocean. The latter is related to recent but weak equatorial westerly wind flow anomalies. The trades are strengthening again, responding to tropical forcing returning to the Eastern Hemisphere. At least for the next few weeks, La-Nina is "reloading."
Let's see if the subtropical easterly wind flow anomalies intensify across the Southern Hemisphere during our upcoming summer. We also need to watch behaviors such the Asian and Indian monsoon systems. The latter tend to be active during La-Nina.
Loosely, a La-Nina base state is favorable for decent summertime rainfall across the Desert Southwest. However, my thoughts are there will be periods of intense western USA heat (again) this summer, increasing the wildfire risk at times.
Regards,
Ed
Post a Comment