The following is a link to our recently accepted paper by MWR which discusses the GSDM (Weickmann and Berry 2006).
http://www.cdc.noaa.gov/MJO/Predictions/wb2006.pdf
The gist is that from taking into consideration the interactions of 4 different subseasonal time scales, a sequence depicting a coherent set of repeatable events has been derived for the Northern Hemisphere cold season from November-March. This set is broken up into 4 stages, referred to as GSDM (for Global Synoptic-Dynamic Model) Stages 1-4 in the text of my Blog. Figure 13 in our paper presents a schematic of the GSDM. Ideally it would be advantageous to post our weather-climate discussions (link at the bottom) with greater frequency to provide additional detail while having a more complete weather-climate record of attribution and prediction. In these discussions I adapt the GSDM for the warm season. Our list of work includes a seasonally adjusted rendition of the GSDM.
An equatorial trade wind surge of ~5-10 m/s led to some cooling of central and east Pacific SSTs during the past week. However anomalies remain slightly above normal west of 120W with ~plus 1-2C warmth down to roughly 200m at the date line. Meanwhile, also during the past week roughly 0.5-1C SST cooling was also observed across the equatorial Indian Ocean. The latter was the result of enhanced rainfall in that region. Still, above average SSTs dominate the global tropics with actual temperatures in excess of 29C from the South Pacific into the Indian Ocean. Additional global SST information can be obtained from latest TAO data here, ESRL/PSD data here, and CPC data
http://www.cpc.ncep.noaa.gov/products/predictions/threats/index_gloss.html.
The following are links to ENSO discussions.
http://www.cdc.noaa.gov/people/klaus.wolter/MEI/
http://www.cpc.ncep.noaa.gov/products/analysis_monitoring/enso_advisory/index.html
While monsoon enhanced convection continues from Indian Ocean into Southeast Asia, a well defined separate region of tropical convective forcing is moving into the western Pacific as I type. Per satellite imagery and monitoring tools such as Hovmoller plots of OLR and their anomalies, this separate area was centered ~ 0/160E (OLRA ~ minus 70-90 W/m**2), and extended from around the date line to eastern Indonesia. The latter region of tropical forcing projects strongly onto a convectively coupled Kelvin wave, per coherent modes Hovmollers. My own loose phase speed calculations have this Kelvin wave moving east at about 10-12 m/s (~8-9 deg of longitude/day), and will be well into the Western Hemisphere by the end of week 1.
A week ago I was expecting a consolidation of both SST boundary and dynamically forced tropical convection, with a possible MJO to develop from this occurrence. There was a brief consolidation ~ 10N/110E a few days ago. However, as we have seen since about mid April, convectively coupled Kelvin waves have been the dominate mode of tropical convective forcing, and that behavior appears to be continuing per above. I did not reflect this possibility very well with my predictive input; and once again, this emphasizes both the importance of daily weather-climate monitoring and forecast uncertainty. Recent week-two NCEP model performance has also been problematic, likely related to the complexity discussed above (see http://www.cpc.ncep.noaa.gov/schemm/z500ac_wk2_na.html , for example).
Whatever I can offer for predictive insight will be made with very low confidence at this point. My feeling is to go with the continuation of convectively coupled Kelvin waves dominating the dynamic signal for tropical forcing while SST boundary forced and monsoon system convection persists from generally Southeast Asia into India. If it stays coherent, the dynamic signal should be around 90W by about the middle of week 2 then moving back into the Eastern Hemisphere after week 3.
Empirical, statistical and numerical prediction tools are inconclusive for useful information about the future evolution of the tropical convection. Please see ESRL/PSD MJO tools , BMRC MJO tools, CPC MJO tools, and http://www.cpc.ncep.noaa.gov/products/precip/CWlink/MJO/index.primjo.html for the details (and draw your own conclusions).
Zonal mean 200mb easterly wind anomalies of ~5-15 m/s continue to propagate into the midlatitude atmospheres of both hemispheres, being replaced with zonal mean westerly anomalies throughout the tropical and subtropical atmospheres. These westerly anomalies were strongest at about 15N, ~15 m/s. Animations of 150mb and 250mb daily mean vector wind anomalies show these westerlies were linked with the divergent outflow from the Indian Ocean tropical convective flare-up which occurred around June 17th. From about June 22-24th, these westerlies were quite expansive across the tropical and subtropical Western Hemisphere (AAM tendency was strongly positive), with easterly wind anomalies from the Indian Ocean into Africa. In fact, the Wheeler Index (EOFs understood) showed a slightly greater than 1 standard deviation MJO projection at that time. This was around the time the tropical forcing was consolidating. A fast Rossby wave energy dispersion tied to the forcing led to the retrogression of the western USA ridge, and also contributed to the excessive rainfall along the East Coast. This dispersion is currently propagating into the Atlantic, easing the heavy rain hazard there. These interactions led to the transition of the global circulation to GSDM Stage 2.
As already discussed, just when it appeared a nice scenario of coherent tropical convective forcing, circulation response and feedbacks was evolving (particularly with the warm SSTs), we saw nothing more than a transient event linked to the Kelvin wave. Equatorial upper tropospheric westerlies remain robust from the central Pacific into the Atlantic while a separate region of enhanced westerlies persists across the subtropical date line region. The dynamic forcing for the latter region of anomalous westerly flow is unclear (one can always speculate); however, these winds appear directed toward the western USA. Finally, whether or not another oceanic Kelvin wave occurs should the low level westerlies (currently across the Indian Ocean into Indonesia) head into the equatorial date line region remains to be seen.
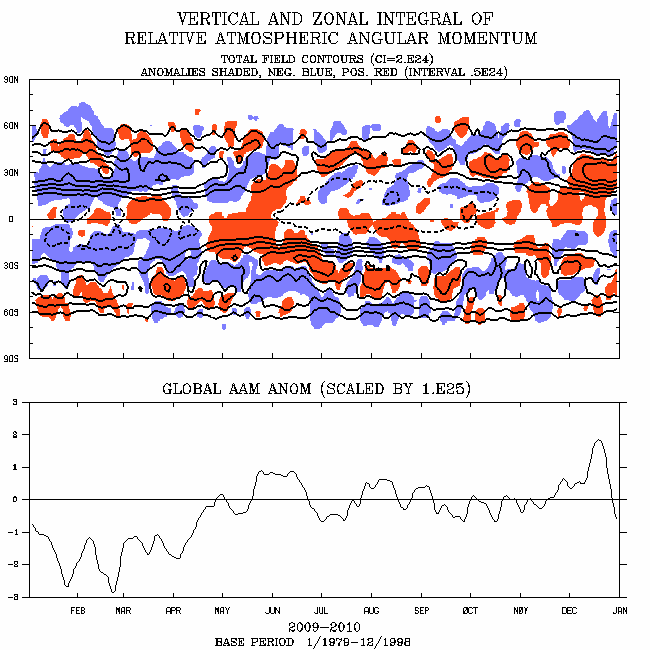
Tropospheric relative AAM continues to increase and is about 1 standard deviation below the 1968-1997 reanalysis data climatology, which lags 3 days from the current time. The operational data plot shows AAM has ~ 2 standard deviations below the 1979-1998 climatology (see http://www.cdc.noaa.gov/map/images/aam/glaam.gif). With contributions still coming from the mountain and frictional torques, the AAM tendency remains positive (links below), but less than its maximum a few days ago.
Within the framework of the GSDM I think we are still in a summertime rendition of GSDM Stage 2 (see plot for mountain torque and plot for the frictional torque; see http://www.cdc.noaa.gov/map/clim/aam.rean.shtml for all AAM budget plots, including tendency). Where we go from here is about as uncertain as it gets (not all that “unusual” for boreal summer). We already know there are at least 2 regions of tropical convective forcing (discussed above), and other warm ocean basins such as the North Tropical Atlantic may also have an impact (and not just from the current Kelvin wave). Very loosely I would think a transition to a summertime version of GSDM Stage 3 during week 1 into week 2 is most probable. Afterwards, uncertainty is too high to offer anything useful.
Week 1 (29 June -5 July 2006): I think there will be more westerly flow coming into the western USA, suggesting a deamplification and downstream progression of the current western CONUS ridge. Most models are trending toward this solution. This should allow some tropical moisture transport from the Gulf of Mexico into the central states during this period (due to at least weak lee-side Rocky Mountain troughs). The East Coast should get a respite from the very heavy rainfall and the Southwest USA monsoon is likely to remain suppressed. Broadly, synoptically we may observe split flow along or just off the North American West Coast (with a ridge in Alaska) and confluent flow across the eastern half of the country. Intense heat may start to build across portions of the Southern and Central Plains.
Active and possibly severe MCSs/Derechoes (along with areas of heavy rainfall) from the Northern and Central Plains into the Great Lakes and Ohio Valley will be a concern as moisture transport improves. Increasing upper tropospheric anomalous westerly flow across the Tropical North Atlantic may lead to an unfavorable environment for tropical cyclogenesis in that region. Please see http://www.nhc.noaa.gov/ for the latest tropical cyclone information.
Week 2 (06–12 July 2006): This is the period when the dynamic tropical convective signal may become robust across the Western Hemisphere. While I can type many scenarios and anyone can take their pick, it is too unclear to offer a predictive solution that is useful, including having a “decent” probability of occurring.
Week 3 (13-19 July 2006): Same as week 2. However, should a dynamic tropical forcing signal (the Kelvin wave) propagate through the Western Hemisphere like we observed during late May and early June, tropical cyclogenesis may be a concern for both the east Pacific and Tropical North Atlantic Oceans.
My last outlook for Southwest Kansas issued a week ago is going down in flames. There is likely to be a synoptic-scale boundary across the Plains that will eventually act as a focus for thunderstorm development, especially as moisture transport from the Gulf of Mexico improves, during week 1. Much of that MCS activity may stay west (linked to the higher terrain) and north/northeast of us as we remain in the warm air (with near-above normal temperatures). However, I would think there should be one or two rounds of storms during the upcoming Independence Day weekend. Afterwards, I am going to leave it unclear.
The time -filtered coherent modes Hovmoller plots of OLR and OLRA are at
http://www.cdc.noaa.gov/map/clim/olr_modes/), velocity potential Hovmollers at http://www.cpc.ncep.noaa.gov/products/intraseasonal/vpot_tlon.html , and an animation of velocity potential overlayed on OLRAs are at http://www.cpc.ncep.noaa.gov/products/precip/CWlink/ir_anim_monthly.shtml.
Satellite imagery and other information can be found from the following links: eastern hemisphere, full-disk west Pacific, mtsat, IO, Africa, http://www.jma.go.jp/en/gms/ ; other imagery here. Latest tropical cyclone statements can be found from http://www.nhc.noaa.gov/, while the latest 3-day averages of OLR totals and anomalies and other data can be found here
http://www.cdc.noaa.gov/map/clim/glbcir.anim.shtml (animations of various fields from the operational data)
http://www.cpc.ncep.noaa.gov/products/precip/CWlink/MJO/mjo.shtml (Global Tropical Hazards Assessment available from this site, along with other useful information)
Latest CDC Ensemble Forecast
Latest NCEP Ensemble Forecast
Additional NCEP Ensemble Output
Latest Canadian Ensemble Output
Latest Deterministic ECMWF Forecasts
http://www.cdc.noaa.gov/people/jeffrey.s.whitaker/refcst/week2/
http://www.cdc.noaa.gov/MJO/Forecasts/climate_discussions.html (link to our Weather-Climate discussions)
Please see the CPC Drought Monitor for areas of dryness and the latest official outlooks and statements from the Storm Prediction Center not only for severe storms, but also fire weather concerns. Finally, the CPC USA Hazards Assessment for offers additional insights not only for possible week 1 high impact weather, but week 2 as well.
I will attempt another posting this upcoming weekend.
Ed Berry
No comments:
Post a Comment