There is little change in the spatial distribution of global tropical SSTs from a week ago. SST anomalies along the equatorial cold tongue from ~165E to the west coast of South America vary from ~minus 1-3C with the coldest around 120W, extending to depths of at least 200m. SST totals of 29C and warmer are well entrenched across the Tropical Northwest Pacific (TNWP) into portions of the South Pacific Ocean loosely centered ~10N/140E. Recall that we use SST totals of 29C as a threshold for supporting persistent deep tropical convective forcing. Recent enhanced convection has slightly reduced the magnitudes of the warm anomalies from a week ago while this anomalously expanded warm pool slowly shifts south with the seasonal cycle. The equatorial Indian Ocean SSTs remain roughly .5-1.5C above normal as do portions of the Caribbean into the deep tropical Atlantic Ocean.
Per time-longitude section plots derived from the TAO buoy data, the evolution of this La-Nina appears not only ahead of the 2005-06 event, but slightly stronger. For instance, SST anomalies of minus 2C and lower have more persistently covered a larger region of the equatorial Pacific Ocean cold tongue, especially east of 140W. Based on the SSTs, the 2005-06 event peaked around February 2006, while this may be in the process of maturing as I type. However, there are complex coupled subseasonal dynamical forcing-response-feedbacks, etc., working with the seasonal cycle. Hence it is still unclear to me when this cold event will mature.
From this point I am not going to repeat what I wrote nearly a week ago since it is still valid, particularly in the interest of striving for some brevity (which failed!). Subseasonal variation #4 of the tropical convective forcing has progressed east-northeast into the west central and TNWP. Full disk satellite imagery and other monitoring tools suggest this forcing is centered ~10-15N/140E, with negative OLR extending from this region into portions of the very warm South Pacific Ocean. An almost separate region of enhanced rainfall is ~20N/60-90E. Finally, linked with a Southern Hemisphere Rossby wave energy dispersion (RWD), a separate intense tropical convective flare-up is developing ~60-70E just south of the equator. The latter may be part of a dynamical process to initiate what could become subseasonal event #5.
However, the most intense tropical forcing currently is across the west central Pacific Ocean, and is impacting the global circulation such as adding weak zonal mean westerly wind flow anomalies to the northern subtropical atmosphere (more said below). Surface westerly wind anomalies ~5m/s extend from the equator into the northwest Pacific Ocean, and it is probable 1 or more tropical cyclones will get spun off from the intense tropical thunderstorm clusters. At this point I do not think an oceanic Kelvin wave will get generated by the weak equatorial surface westerly anomalies.
Satellite animations and OLR/A Hovmoller plots do suggest the west Pacific convection to be drifting generally west, and may consolidate with the forcing loosely centered on the Bay of Bengal. Adding a bit more detail, during ~weeks 1-2 I would expect a portion of the west central Pacific convection to shift back to the northwest possibly in the form of tropical cyclones while the South Pacific Convergence Zone (SPCZ) becomes enhanced. Tropical convection may once again become quite intense from 60-90E while consolidating with the forcing farther east and north. I would speculate that during the next few weeks, tropical convective forcing should be nicely consolidated centered in the region of 100-120E along and just north of the equator. The latter is a consistent tropical convective signal with both La-Nina and the seasonal cycle. Again, make no mistake about the valid concerns I have of our nemesis. Whatever the case may be, the problem of 2 regions of Eastern Hemisphere tropical convective forcing will be a global weather-climate issue through at least DJF 2007-08.
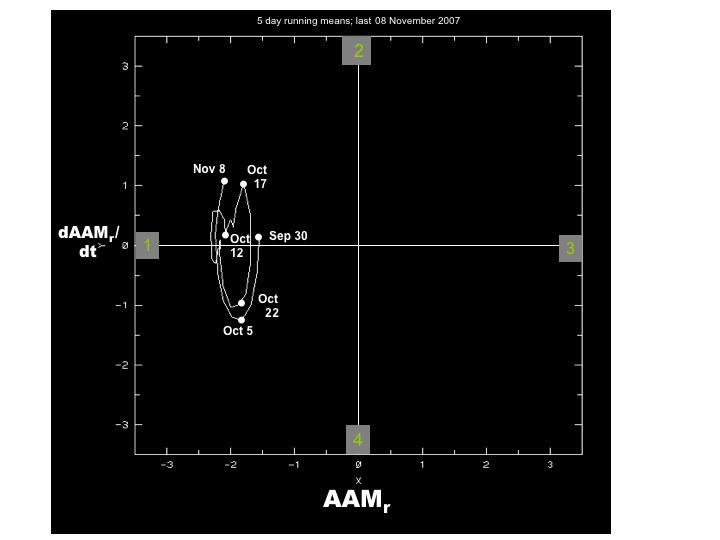
Global relative AAM remains well below the R1 data climatology (updated through 24 September) by roughly 2 atmospheric momentum units (1 AMU = 1*10**24 Kg m/s**2) which is also approximately 2 standard deviations. A week ago I thought given the fairly strong poleward transport AAM signal across the Northern Hemisphere midlatitudes we would see a global response from the surface torques. However, that has not occurred. Updated through 21 September the Global Wind Oscillation (GWO) was still stuck at GSDM Stage 1 at roughly 2 standard deviations, and I do not think there has been much change since. From a zonal mean perspective there has been a recent weakly positive East Asian mountain torque, with a positive frictional torque of roughly 10 Hadleys (1 Hadley = 1*10**18 Kg m**2/s**2 = 1*10**18 J) at 30N compensated by dissipation at 50N. The latter are linked to an increase of storm track activity across the Northern Hemisphere midlatitudes.
The most significant point in regard to global relative AAM and zonal mean variations is that zonal mean anomalous easterly wind flow throughout the troposphere has been propagating off the equator into the subtropical atmospheres of both hemispheres since around 10 August (~10m/s at 200mb). This propagation has been to about 35N and 20S, and was tied to subseasonal tropical events #3 and # 4. In fact, the tropical convective flare-up across the TWNP discussed above has actually added weak zonal westerly wind flow anomalies (coming from the Western Hemisphere Pacific Ocean) from the equator to ~20N. As a La-Nina matures, it is typical to observe this kind of atmospheric behavior.
On the poleward flanks of these anomalous zonal mean easterly winds, westerly wind flow anomalies have also been increasing, especially across the higher latitudes of the Northern Hemisphere. The latter is not only due to seasonal transition into boreal autumn, but also a direct response to poleward shifted anomalous ridges dynamically forced by the meridional propapagtion of the zonal mean easterly wind flow anomalies discussed above. In fact, the zonal mean earth AAM is ~plus .2-.4 AMUs around 40-50N meaning an increase of atmospheric mass suggestive of anomalously high surface pressures (see the references in WB2007). I believe this is why extratropical storm track activity across the Northern Hemisphere midlatitudes has been increasing. This whole diagnosis is yet another example how our evolving La-Nina is already impacting the global synoptic variability (and has been since boreal winter). I disagree with any statements to the contrary from anywhere, particularly from the viewpoint of subseasonal atmospheric variability.
The global circulation is coupled to the developing cold event. RWDs from the west central and TNWP tropical convective forcing have also been strengthening westerly flow across the North Pacific Ocean. In fact, a fairly well defined residual of RWD activity linking both the Indian Ocean and west central Pacific forcing can be observed from weekly mean anomalies of 150mb vector winds. Wind speed anomalies greater than 15m/s have been common with these RWDs. Animations of upper tropospheric daily mean vector wind anomalies show twin tropical/subtropical anticyclones across both the Indian and west central Pacific Ocean basins, with the usual downstream cyclones generally around the date line, typical of GSDM Stage 1. So far the equatorial westerly wind anomalies tied to these twin lows have been mostly propagating into the Southern Hemisphere via South America (through RWDs), increasing their extratropical westerly flow.
Remembering the AAM considerations discussed above, these twin anticyclones are anchoring RWDs which are in the process of generating an extremely strong poleward shifted (~50-60N) north Pacific Ocean jet. This past JJA tropical forcing remained generally in the region of India, and in the presence of the boreal summer base state, troughs stayed offshore of North America favoring “Devil Ridges”. Now, anomalously intense troughs are probable to pound the western half of the USA for at least the next couple of weeks. This situation is stronger than I would have expected a week ago. The first of these will be an anticyclonically wave breaking event typical of GSDM Stage 1 this weekend. However, that character may locally change across North America given the west central Pacific Ocean signal. I do think there will be a mountain-frictional torque index cycle like variation during the next few weeks meaning a brief GWO orbit toward GSDM Stage 2.
The global numerical ensemble prediction systems (as part of a complete forecast process including the GSDM) continue to struggle with the synoptic details. However, there is good agreement for a western USA trough and eastern states ridge. There are some ensemble members suggesting a Stage 2 like pattern for North America starting late week 2. That response suggests a ridge west of North America well into Alaska and a deep central USA trough.
The bottom line is much of the USA is in for an unusually active early autumn regime for at least the next couple of weeks. Most of Alaska should have colder than normal temperatures with periods of rain and snow on the north side of the strong Pacific jet. In addition to significant mountain snowfall particularly west of the Continental Divide (for the CONUS), early season severe downslope wind storms are probable at times across the central and Northern Rockies. Periods of heavy rainfall along with episodes of severe local storms including tornadoes are probable for much of the Plains, starting this weekend. Much of the east will continue with summertime warmth. During week-2 colder polar air (still need the Arctic Ocean to “freeze” to have a good cold air source) should dump into much of the Rockies and even portions of the Northern Plains. It would not surprise me to see an early season significant snowstorm for locations such as eastern Wyoming-Montana into the western Dakotas.
I would expect a respite from this active pattern during the latter part of October into November. However, I will restate that as boreal winter approaches, western USA troughs should become stronger and more persistent, leading to an active southwest flow storm track across the Plains. This type of pattern can be favorable for Arctic outbreaks combined with intense precipitation. Should our nemesis become the rule, perhaps GSDM Stage 4-1 may start out the boreal cold season leading to GSDM Stage 3-4 if an El-Nino starts to develop during winter-spring 2008.
Careful daily monitoring of tropical forcing across the very warm west central Pacific Ocean is a must starting now. For instance, my assessment for the Eastern Hemisphere tropical forcing to again consolidate may get "blown out of the water (pun?)" if the current west central Pacific Ocean convection takes over now given the very warm SSTs. Ramifications could then be completely different much sooner, which is simply a testament to growing uncertainty.
Please see the latest statements from the NOAA/NWS/Tropical Prediction Center for tropical cyclone statements. Tropical cyclone activity did become more robust that I thought a week ago, with much of that coming from “Gabrielles”. Right now Tropical Storm Karen is fighting wind shear and stability per concerns discussed in past postings. Nevertheless, attention still needs to be paid to the tropical cyclone hazard not only from the Atlantic Ocean but also the Caribbean. The USA is by no means “out of the woods”.
The west central into the northwest Pacific Ocean is probable to continue with a tropical cyclone hazard through week 2. Impact areas include the Philippines possibly north into Japan. Another area of concern is the Bay of Bengal including coastal sections. In general, locations from India into Southeast Asia are still probable to continue with rounds of intense/severe thunderstorms through at least week 2. Much of the North Atlantic into Europe is probable to continue with active weather also for at least the next couple of weeks. On the latter, there are some ensemble members suggesting a period for troughs to remain west Europe especially week-2, meaning warmer and dryer weather.
Appendix
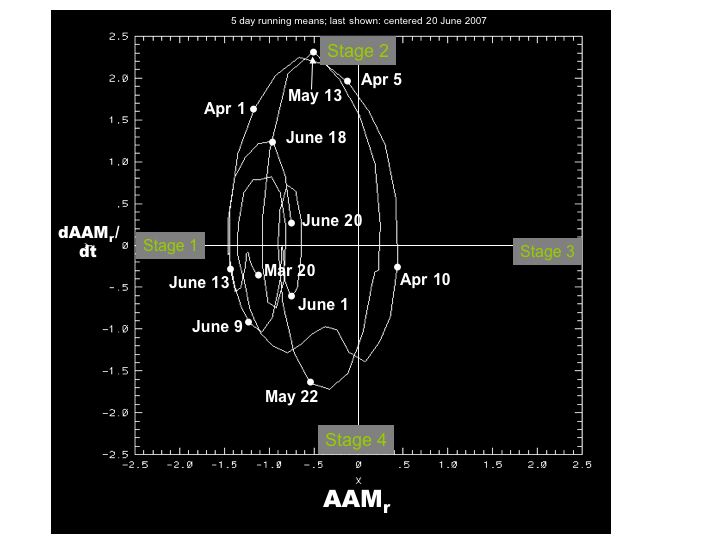
An experimental quasi-phase space plot of the GSDM utilizing a time series of normalized relative AAM tendency anomaly (Y-axis) and normalized relative AAM anomaly time series (X-axis) can be found at
http://www.cdc.noaa.gov/map/images/gcm/gsdm_95d.jpg
http://www.cdc.noaa.gov/map/images/gcm/gsdm_40d.jpg
http://www.cdc.noaa.gov/map/clim/gsdm.shtml
We call the behavior of this plot the Global Wind Oscillation (GWO). While the intent of the GSDM is to extend current thinking beyond the MJO, the purpose of the GWO is to illustrate the non-oscillatory stochastically forced component of the GSDM.
These are probabilistic statements, and work is ongoing to quantify in future posts (for example, risk assessment maps, signal to noise ratio plots and shifts of probability). We hope that an opportunity will arise for us to have a dedicated web page effort to expedite more objectively, with rigor, thoroughness and verification. The WB (2007) paper on the GSDM has been published in the February issue of MWR. I will be on travel and my next discussion will not be until ~ 4-5 October at the earliest. Difficulty will increase keeping these discussions current.
Ed Berry
Thursday, September 27, 2007

Friday, September 21, 2007
La-Nina in Command, Nemesis Lurks
The spatial distribution of global tropical SSTs has become much more consistent with what may be evolving into a basin-wide cold event. Per TAO buoy data and CPC analyses, negative equatorial SST anomalies currently extend from about 160-165E to South America. Cold anomalies are greater than minus 2C ~130W extending to at least a depth of 200m near 160W. Given the seasonal cycle, these anomalies are not trivial.
The Indian and particularly the west central Pacific Ocean basins remain warmer than climatology. Anomalies are greater than 2C with totals in excess of 30C for the latter, with a warm horseshoe spatial pattern extending into the extratropics. The warmth across the west central Pacific has shifted slightly to the south during the past week. Slightly warmer than average SSTs remain from the Caribbean into the north tropical Atlantic Ocean.
My own feeling is during the past 4-6 weeks we have been observing the equatorial SSTs respond to the atmosphere (discussed below), going back to subseasonal variations late boreal fall 2006. There is now observational evidence that ocean-atmosphere coupling has been starting to occur during the last few weeks. However, the problem of 2 regions of tropical convective forcing: west central Pacific and Indian Ocean basins, remains. I also remain concerned this La-Nina will mature before the heart of boreal winter.
Tropical convective forcing continues strong across the Eastern Hemisphere, centered ~10-15N/120E while extending from the central Indian into the northwest and west central Pacific Ocean basins. This represents a loose consolidation between the Indian and west central Pacific Oceans tropical forcing since early this year. As a response the easterly trades along the equator have strengthened during the past several weeks, with wind speed anomalies in excess of 5m/s at times, leading to the recent SST cooling discussed above.
Four subseasonal variations consisting of northeastward propagation of tropical convection within this stationary signal have occurred since ~1 June 2007. These have had periods of ~30 days, and I do not consider these to be MJOs. These events have had strong interactions with the extratropics including ~15 day variations of the global mountain torque. Event number 3 occurred prior to 1 September and number 4 is in progress as I type, currently enhancing convection around the Philippines. In fact, from the full disk satellite imagery and OLR/A Hovmollers, I can still easily identify 2 regions of enhanced tropical rainfall, the north central Indian Ocean and from the west central into the northwest Pacific. The point is these subseasonal variations may lead us back to “nemesis” by boreal winter.
The last subseasonal event had a decent zonal mean anomalous poleward AAM transport signal in the 30-60N band around mid August, followed the ~30 Hadley positive global mountain torque just before the start of this month. As of 19 September per ESRL/PSD R1 AAM plots, once again there is a strong poleward AAM transport signal in the 30-60N band (~0.5-1 Hadleys), and another decent positive global mountain torque event may be probable. These types of behaviors have been contributing to the poleward propagation zonal mean easterly wind flow anomalies from the equatorial into the subtropical atmospheres of both hemispheres. In fact, at 200mb while zonal mean easterly wind anomalies of ~5-10m/s are present around 25-30N, there are weak zonal mean westerly wind flow anomalies along the equator. The latter are tied to twin upper tropospheric tropical cyclones ~150W. The Global Wind Oscillation (GWO) quasi-phase space plot updated through 18 September shows at least 2 circuits around GSDM Stage 1 since mid August due to the subseasonal events and meridional propagation of the anomalous zonal mean equatorial easterlies.
Global relative AAM remains low, ~ 2 AMUs below the R1 data climatology, while the GWO is still minus 2 standard deviations at GSDM Stage 1 (typical of La-Nina). The global frictional torque is only slightly positive but increasing. I think the global mountain torque will increase forcing the AAM tendency upward during the next 1-2 weeks. Anomalous zonal mean westerly flow, roughly 10m/s at 200mb, continues poleward of the easterly wind anomalies, ~50N and 40S. This translates to anomalously strong and poleward shifted ridges for both hemispheres.
Animations of upper tropospheric daily mean vector wind anomalies give a relatively simple and stationary picture (at least in a weekly mean) of twin tropical/subtropical anticyclones ~120E with downstream cyclones ~150W. Rossby wave energy disperions arcing from this tropical forced response into the extratropics link up nicely to central Pacific Ocean ridges and western continental troughs across the Americas. This whole pattern is roughly a 30 degree westward shift from about 10 days ago. In fact, poleward amplification of midlatitude ridges across the Southern Hemisphere into the high latitudes may lead to a rare sudden stratospheric warming (SSW) in the Antarctica region (currently austral spring). Per Tokyo Climate Center E-P fluxes have been strongly directed upward at 60S and 10hPa temperatures have risen at least 35C since early this month.
I think we are now observing a coupled response involving the tropical SSTs, enhanced Eastern Hemisphere tropical convection and the global circulation. To me, this whole evolution started late boreal fall 2006 first with the Indian Ocean tropical forcing dominating, then La-Nina like atmospheric base state commencing ~ 1 December 2006, and finally the SSTs catching up. Given that the anomalous zonal mean easterlies are propagating off the equator; I remain concerned this La-Nina may mature before 2008. In any case, the evolution toward a coupled La-Nina (meaning not just the atmosphere) is already impacting the synoptic weather variability not only across North America, but globally.
Most week 1-2 ensemble means from the global operational centers show the general west coast-Rockies USA trough and eastern states ridge. Model agreement should be better now given possible coupling. This means an active flow regime for much of the western 2/3rds of the country, and temperature and precipitation anomalies should be understood by now. Particular attention will need to be paid to the Pacific Northwest as strong baroclinic storms containing high winds and heavy rain periodically move ashore. I have a thought for a brief GSDM Stage 2 response after an intense baroclinic storm moves across the Plains next weekend. I tie this to the possibility of a mountain-frictional torque variation linked to subseasonal #4 discussed above.
As boreal winter approaches, western USA troughs should become stronger and more persistent, leading to an active southwest flow storm track across the Plains. This type of pattern can be favorable for Arctic outbreaks combined with intense precipitation. Should our nemesis become the rule, perhaps GSDM Stage 4-1 may start out the boreal cold season leading to GSDM Stage 3-4 if an El-Nino starts to develop during winter-spring 2008. On the latter, careful daily monitoring of tropical forcing across the very warm west central Pacific is a must starting now.
Please see the latest statements from the NOAA/NWS/Tropical Prediction Center for tropical cyclone statements. Per reasons discussed in my 14 September posting, I think AWB has put the kibosh on the Atlantic tropical cyclone season, at least for now. Yes, there is another “Gabrielle” festering as TD#10.
The west central into the northwest Pacific Ocean is probable to continue with a tropical cyclone hazard through week 2. Impact areas include the Philippines possibly north into Japan. Another area of concern is the Bay of Bengal including coastal sections. In general, locations from India into Southeast Asia are probable to continue with rounds of intense/severe thunderstorms. Much of Europe is probable to have active weather for at least the next couple of weeks.
Appendix
An experimental quasi-phase space plot of the GSDM utilizing a time series of normalized relative AAM tendency anomaly (Y-axis) and normalized relative AAM anomaly time series (X-axis) can be found at
http://www.cdc.noaa.gov/map/images/gcm/gsdm_95d.jpg
http://www.cdc.noaa.gov/map/images/gcm/gsdm_40d.jpg
http://www.cdc.noaa.gov/map/clim/gsdm.shtml
We call the behavior of this plot the Global Wind Oscillation (GWO). While the intent of the GSDM is to extend current thinking beyond the MJO, the purpose of the GWO is to illustrate the non-oscillatory stochastically forced component of the GSDM.
These are probabilistic statements, and work is ongoing to quantify in future posts (for example, risk assessment maps, signal to noise ratio plots and shifts of probability). We hope that an opportunity will arise for us to have a dedicated web page effort to expedite more objectively, with rigor, thoroughness and verification. The WB (2007) paper on the GSDM has been published in the February issue of MWR. I will try to post another discussion ~ 28 September.
Ed Berry
The Indian and particularly the west central Pacific Ocean basins remain warmer than climatology. Anomalies are greater than 2C with totals in excess of 30C for the latter, with a warm horseshoe spatial pattern extending into the extratropics. The warmth across the west central Pacific has shifted slightly to the south during the past week. Slightly warmer than average SSTs remain from the Caribbean into the north tropical Atlantic Ocean.
My own feeling is during the past 4-6 weeks we have been observing the equatorial SSTs respond to the atmosphere (discussed below), going back to subseasonal variations late boreal fall 2006. There is now observational evidence that ocean-atmosphere coupling has been starting to occur during the last few weeks. However, the problem of 2 regions of tropical convective forcing: west central Pacific and Indian Ocean basins, remains. I also remain concerned this La-Nina will mature before the heart of boreal winter.
Tropical convective forcing continues strong across the Eastern Hemisphere, centered ~10-15N/120E while extending from the central Indian into the northwest and west central Pacific Ocean basins. This represents a loose consolidation between the Indian and west central Pacific Oceans tropical forcing since early this year. As a response the easterly trades along the equator have strengthened during the past several weeks, with wind speed anomalies in excess of 5m/s at times, leading to the recent SST cooling discussed above.
Four subseasonal variations consisting of northeastward propagation of tropical convection within this stationary signal have occurred since ~1 June 2007. These have had periods of ~30 days, and I do not consider these to be MJOs. These events have had strong interactions with the extratropics including ~15 day variations of the global mountain torque. Event number 3 occurred prior to 1 September and number 4 is in progress as I type, currently enhancing convection around the Philippines. In fact, from the full disk satellite imagery and OLR/A Hovmollers, I can still easily identify 2 regions of enhanced tropical rainfall, the north central Indian Ocean and from the west central into the northwest Pacific. The point is these subseasonal variations may lead us back to “nemesis” by boreal winter.
The last subseasonal event had a decent zonal mean anomalous poleward AAM transport signal in the 30-60N band around mid August, followed the ~30 Hadley positive global mountain torque just before the start of this month. As of 19 September per ESRL/PSD R1 AAM plots, once again there is a strong poleward AAM transport signal in the 30-60N band (~0.5-1 Hadleys), and another decent positive global mountain torque event may be probable. These types of behaviors have been contributing to the poleward propagation zonal mean easterly wind flow anomalies from the equatorial into the subtropical atmospheres of both hemispheres. In fact, at 200mb while zonal mean easterly wind anomalies of ~5-10m/s are present around 25-30N, there are weak zonal mean westerly wind flow anomalies along the equator. The latter are tied to twin upper tropospheric tropical cyclones ~150W. The Global Wind Oscillation (GWO) quasi-phase space plot updated through 18 September shows at least 2 circuits around GSDM Stage 1 since mid August due to the subseasonal events and meridional propagation of the anomalous zonal mean equatorial easterlies.
Global relative AAM remains low, ~ 2 AMUs below the R1 data climatology, while the GWO is still minus 2 standard deviations at GSDM Stage 1 (typical of La-Nina). The global frictional torque is only slightly positive but increasing. I think the global mountain torque will increase forcing the AAM tendency upward during the next 1-2 weeks. Anomalous zonal mean westerly flow, roughly 10m/s at 200mb, continues poleward of the easterly wind anomalies, ~50N and 40S. This translates to anomalously strong and poleward shifted ridges for both hemispheres.
Animations of upper tropospheric daily mean vector wind anomalies give a relatively simple and stationary picture (at least in a weekly mean) of twin tropical/subtropical anticyclones ~120E with downstream cyclones ~150W. Rossby wave energy disperions arcing from this tropical forced response into the extratropics link up nicely to central Pacific Ocean ridges and western continental troughs across the Americas. This whole pattern is roughly a 30 degree westward shift from about 10 days ago. In fact, poleward amplification of midlatitude ridges across the Southern Hemisphere into the high latitudes may lead to a rare sudden stratospheric warming (SSW) in the Antarctica region (currently austral spring). Per Tokyo Climate Center E-P fluxes have been strongly directed upward at 60S and 10hPa temperatures have risen at least 35C since early this month.
I think we are now observing a coupled response involving the tropical SSTs, enhanced Eastern Hemisphere tropical convection and the global circulation. To me, this whole evolution started late boreal fall 2006 first with the Indian Ocean tropical forcing dominating, then La-Nina like atmospheric base state commencing ~ 1 December 2006, and finally the SSTs catching up. Given that the anomalous zonal mean easterlies are propagating off the equator; I remain concerned this La-Nina may mature before 2008. In any case, the evolution toward a coupled La-Nina (meaning not just the atmosphere) is already impacting the synoptic weather variability not only across North America, but globally.
Most week 1-2 ensemble means from the global operational centers show the general west coast-Rockies USA trough and eastern states ridge. Model agreement should be better now given possible coupling. This means an active flow regime for much of the western 2/3rds of the country, and temperature and precipitation anomalies should be understood by now. Particular attention will need to be paid to the Pacific Northwest as strong baroclinic storms containing high winds and heavy rain periodically move ashore. I have a thought for a brief GSDM Stage 2 response after an intense baroclinic storm moves across the Plains next weekend. I tie this to the possibility of a mountain-frictional torque variation linked to subseasonal #4 discussed above.
As boreal winter approaches, western USA troughs should become stronger and more persistent, leading to an active southwest flow storm track across the Plains. This type of pattern can be favorable for Arctic outbreaks combined with intense precipitation. Should our nemesis become the rule, perhaps GSDM Stage 4-1 may start out the boreal cold season leading to GSDM Stage 3-4 if an El-Nino starts to develop during winter-spring 2008. On the latter, careful daily monitoring of tropical forcing across the very warm west central Pacific is a must starting now.
Please see the latest statements from the NOAA/NWS/Tropical Prediction Center for tropical cyclone statements. Per reasons discussed in my 14 September posting, I think AWB has put the kibosh on the Atlantic tropical cyclone season, at least for now. Yes, there is another “Gabrielle” festering as TD#10.
The west central into the northwest Pacific Ocean is probable to continue with a tropical cyclone hazard through week 2. Impact areas include the Philippines possibly north into Japan. Another area of concern is the Bay of Bengal including coastal sections. In general, locations from India into Southeast Asia are probable to continue with rounds of intense/severe thunderstorms. Much of Europe is probable to have active weather for at least the next couple of weeks.
Appendix
An experimental quasi-phase space plot of the GSDM utilizing a time series of normalized relative AAM tendency anomaly (Y-axis) and normalized relative AAM anomaly time series (X-axis) can be found at
http://www.cdc.noaa.gov/map/images/gcm/gsdm_95d.jpg
http://www.cdc.noaa.gov/map/images/gcm/gsdm_40d.jpg
http://www.cdc.noaa.gov/map/clim/gsdm.shtml
We call the behavior of this plot the Global Wind Oscillation (GWO). While the intent of the GSDM is to extend current thinking beyond the MJO, the purpose of the GWO is to illustrate the non-oscillatory stochastically forced component of the GSDM.
These are probabilistic statements, and work is ongoing to quantify in future posts (for example, risk assessment maps, signal to noise ratio plots and shifts of probability). We hope that an opportunity will arise for us to have a dedicated web page effort to expedite more objectively, with rigor, thoroughness and verification. The WB (2007) paper on the GSDM has been published in the February issue of MWR. I will try to post another discussion ~ 28 September.
Ed Berry
Saturday, September 15, 2007
Nemesis
The spatial distribution of global tropical SSTs has not undergone any huge changes since a week ago. The La-Nina pattern is in place along the equator with ~minus 1-2C anomalies from about the date line to South America with the coolest around 125W (including Nino 3.4). These anomalously cool ocean waters extend to roughly 200m (TAO data) with magnitudes less than minus 3C near 100m/140W. Increased trades during the last week or so have intensified the negative SST anomalies along the equatorial Pacific Ocean cold tongue.
Across the Eastern Hemisphere I am getting a bit concerned about an emerging recent familiar spatial SST pattern, in this case featuring a warm Indian Ocean-cool Indonesia and very warm west central/northwest Pacific Ocean. SST totals across the equatorial Indian Ocean are ~29C and in excess of 30C over the Tropical Northwest Pacific (TNWP). This has some similarities to what was observed about a year ago, and may signal the return to 2 (at least episodic) regions of Eastern Hemisphere tropical convective forcing; the Indian and west central Pacific Oceans. As I have previously stated, this is a nemesis going back to the 2001-02 boreal cold season (global warming SST signal?).
During boreal autumn 2006 the Indian Ocean tropical convective forcing dominated and contributed to putting the kibosh on El-Nino ~ 1 December. Will the warm west central Pacific Ocean tropical forcing start to dominate going into 2008? My own speculation is to have that concern (read between the lines!). In any case, La-Nina SSTs and a coupled circulation response (~GSDM Stage 1.5) are probable the rest of this year.
Weekly averaged anomalies of outgoing longwave radiation (OLRA) present a nice signal of enhancement ~10N/60E and ~10N/140E, with suppression in between. The stationary component is the former while the latter has been forced by dynamical processes linked to the extratropics. Specifically, the Global Wind Oscillation (GWO) has done a reasonable job of capturing recent circulation impacts linked to a strong positive global mountain torque (~ plus 30 Hadleys; mostly Andes and East Asia) just prior to 1 September. Updated through 7 September the GWO was ~ GSDM Stage 1.5. Any MJO signal is weak and incoherent.
These complex interactions involved a chain of events leading to a strong inter-hemispheric symmetry of Rossby wave energy dispersions from the west central Pacific. Shown in weekly mean anomalies of 250mb vector winds (for example), strong ridges developed across eastern Alaska and west of South America. Wind flow anomalies were ~20-30m/s. This evolution led to cold regimes across the central USA and central South America, and the numerical models did not predict any of these behaviors very well for week 2.
Full disk satellite imagery and other monitoring tools have shown the TWNP tropical forcing to generally shift northwest with at least a couple of tropical cyclones during the last week. The Indian Ocean forcing has drifted to ~10N/80E and may consolidate with the convection to the east, typical of La-Nina. Global relative AAM remains ~minus 2 Atmospheric Momentum Units (AMUs, using the mks system) per R1 data, having decreased a bit during the past few days. I think the GWO is drifting back toward GSDM Stage 1, particularly since the global mountain torque and AAM tendency was weakly negative ~minus 10 Hadleys through 11 September, and the AAM transport signal is again directed poleward.
There is some evidence of the strong anomalies of deep zonal mean easterly wind flow to have propagated poleward from the equator into the subtropical atmospheres of both hemispheres since ~10 August. The recent TNWP convection did contribute, with, in fact, ~5m/s at 200mb westerly wind flow anomalies developing along the equator. A key circulation response to La-Nina is for these zonal mean easterly wind anomalies to propagate off the equator. Perhaps this process may occur with a series of subseasonal events. However, already starting to observe this response expresses a concern for this cold event to peak during boreal autumn.
Animations of upper tropospheric daily mean vector wind anomalies present a reasonable signal of twin tropical/subtropical anticyclones near 90E with twin cyclones near 150E. These circulation gyres are directly linked to both the Eastern Hemisphere tropical convective forcing and PNA/PSA RWDs discussed above. There has been a westward shift of all the above for the past few days, meaning the next trough to impact North America will maximize in the region of the west coast. This is consistent with the GWO, and all numerical ensembles forecast this general idea for weeks 1-2.
I think readers should be familiar with USA weather impacts due to a western states trough and eastern USA/Deep South ridge (understanding the seasonal cycle). More strong/severe baroclinic storms developing off of East Asia are probable to impact Alaska and the Gulf of Alaska periodically for at least the next couple of weeks.
Particularly with the recent meridional propagation of zonal mean easterly wind flow anomalies, our base state is very much susceptible (probabilistically) to lower and midlatitude anticyclonically wave breaking (AWB) lows. One of these has been limiting the development of Tropical Cyclone Ingrid across the western Atlantic (more said below). I think the models have the right idea of an AWB low along the USA west coast later week 1 only to eject into the Plains week 2 (linking with a subtropical jet emanating from the twin 150E tropical cyclones). I think seasonal transition to the boreal cold season will limit western USA troughs until the November-December period. Should our nemesis become the rule, perhaps GSDM Stage 4-1 may start out the boreal cold season leading to GSDM Stage 3-4 if an El-Nino starts to develop during winter-spring 2008.
Please see the latest statements from the NOAA/NWS/Tropical Prediction Center for tropical cyclone statements. A week ago I tried to be favorable for the notion of Atlantic tropical cyclogenesis. Given what I have been monitoring and writing in these postings all summer, what was I thinking??? AWB, which has been a limiting factor for Atlantic tropical cyclogenesis all summer, has only intensified during the past week. The ~20-30m/s upper tropospheric equatorial westerly wind flow anomalies across the Pacific downstream from the twin tropical cyclones appear to heading into central South America, apparently having limited local impact across the tropical Atlantic Ocean. This situation of AWB needs to change if additional true tropical cyclones are to develop in the Atlantic basin (above climatology). For the USA, the concern may have to focus on hybids like Gabrielle and Humberto.
The TNWP is probable to continue with a tropical cyclone hazard week 1 hopefully relaxing week 2. Impact areas include the Philippines north into at least Japan. There is evidence that the Eastern Hemisphere convection is starting to drift south, meaning locations from India into Southeast Asia are probable to continue with rounds of intense/severe thunderstorms through week 2. Finally, I can also see some concern for 1-2 strong/severe extratropical cyclones to slam at least northern Europe weeks 1-2.
Appendix
An experimental quasi-phase space plot of the GSDM utilizing a time series of normalized relative AAM tendency anomaly (Y-axis) and normalized relative AAM anomaly time series (X-axis) can be found at
http://www.cdc.noaa.gov/map/images/gcm/gsdm_95d.jpg
http://www.cdc.noaa.gov/map/images/gcm/gsdm_40d.jpg
http://www.cdc.noaa.gov/map/clim/gsdm.shtml
We call the behavior of this plot the Global Wind Oscillation (GWO). While the intent of the GSDM is to extend current thinking beyond the MJO, the purpose of the GWO is to illustrate the non-oscillatory stochastically forced component of the GSDM.
These are probabilistic statements, and work is ongoing to quantify in future posts (for example, risk assessment maps, signal to noise ratio plots and shifts of probability). We hope that an opportunity will arise for us to have a dedicated web page effort to expedite more objectively, with rigor, thoroughness and verification. The WB (2007) paper on the GSDM has been published in the February issue of MWR. I will try to post another discussion ~ 21 September.
Ed Berry
Across the Eastern Hemisphere I am getting a bit concerned about an emerging recent familiar spatial SST pattern, in this case featuring a warm Indian Ocean-cool Indonesia and very warm west central/northwest Pacific Ocean. SST totals across the equatorial Indian Ocean are ~29C and in excess of 30C over the Tropical Northwest Pacific (TNWP). This has some similarities to what was observed about a year ago, and may signal the return to 2 (at least episodic) regions of Eastern Hemisphere tropical convective forcing; the Indian and west central Pacific Oceans. As I have previously stated, this is a nemesis going back to the 2001-02 boreal cold season (global warming SST signal?).
During boreal autumn 2006 the Indian Ocean tropical convective forcing dominated and contributed to putting the kibosh on El-Nino ~ 1 December. Will the warm west central Pacific Ocean tropical forcing start to dominate going into 2008? My own speculation is to have that concern (read between the lines!). In any case, La-Nina SSTs and a coupled circulation response (~GSDM Stage 1.5) are probable the rest of this year.
Weekly averaged anomalies of outgoing longwave radiation (OLRA) present a nice signal of enhancement ~10N/60E and ~10N/140E, with suppression in between. The stationary component is the former while the latter has been forced by dynamical processes linked to the extratropics. Specifically, the Global Wind Oscillation (GWO) has done a reasonable job of capturing recent circulation impacts linked to a strong positive global mountain torque (~ plus 30 Hadleys; mostly Andes and East Asia) just prior to 1 September. Updated through 7 September the GWO was ~ GSDM Stage 1.5. Any MJO signal is weak and incoherent.
These complex interactions involved a chain of events leading to a strong inter-hemispheric symmetry of Rossby wave energy dispersions from the west central Pacific. Shown in weekly mean anomalies of 250mb vector winds (for example), strong ridges developed across eastern Alaska and west of South America. Wind flow anomalies were ~20-30m/s. This evolution led to cold regimes across the central USA and central South America, and the numerical models did not predict any of these behaviors very well for week 2.
Full disk satellite imagery and other monitoring tools have shown the TWNP tropical forcing to generally shift northwest with at least a couple of tropical cyclones during the last week. The Indian Ocean forcing has drifted to ~10N/80E and may consolidate with the convection to the east, typical of La-Nina. Global relative AAM remains ~minus 2 Atmospheric Momentum Units (AMUs, using the mks system) per R1 data, having decreased a bit during the past few days. I think the GWO is drifting back toward GSDM Stage 1, particularly since the global mountain torque and AAM tendency was weakly negative ~minus 10 Hadleys through 11 September, and the AAM transport signal is again directed poleward.
There is some evidence of the strong anomalies of deep zonal mean easterly wind flow to have propagated poleward from the equator into the subtropical atmospheres of both hemispheres since ~10 August. The recent TNWP convection did contribute, with, in fact, ~5m/s at 200mb westerly wind flow anomalies developing along the equator. A key circulation response to La-Nina is for these zonal mean easterly wind anomalies to propagate off the equator. Perhaps this process may occur with a series of subseasonal events. However, already starting to observe this response expresses a concern for this cold event to peak during boreal autumn.
Animations of upper tropospheric daily mean vector wind anomalies present a reasonable signal of twin tropical/subtropical anticyclones near 90E with twin cyclones near 150E. These circulation gyres are directly linked to both the Eastern Hemisphere tropical convective forcing and PNA/PSA RWDs discussed above. There has been a westward shift of all the above for the past few days, meaning the next trough to impact North America will maximize in the region of the west coast. This is consistent with the GWO, and all numerical ensembles forecast this general idea for weeks 1-2.
I think readers should be familiar with USA weather impacts due to a western states trough and eastern USA/Deep South ridge (understanding the seasonal cycle). More strong/severe baroclinic storms developing off of East Asia are probable to impact Alaska and the Gulf of Alaska periodically for at least the next couple of weeks.
Particularly with the recent meridional propagation of zonal mean easterly wind flow anomalies, our base state is very much susceptible (probabilistically) to lower and midlatitude anticyclonically wave breaking (AWB) lows. One of these has been limiting the development of Tropical Cyclone Ingrid across the western Atlantic (more said below). I think the models have the right idea of an AWB low along the USA west coast later week 1 only to eject into the Plains week 2 (linking with a subtropical jet emanating from the twin 150E tropical cyclones). I think seasonal transition to the boreal cold season will limit western USA troughs until the November-December period. Should our nemesis become the rule, perhaps GSDM Stage 4-1 may start out the boreal cold season leading to GSDM Stage 3-4 if an El-Nino starts to develop during winter-spring 2008.
Please see the latest statements from the NOAA/NWS/Tropical Prediction Center for tropical cyclone statements. A week ago I tried to be favorable for the notion of Atlantic tropical cyclogenesis. Given what I have been monitoring and writing in these postings all summer, what was I thinking??? AWB, which has been a limiting factor for Atlantic tropical cyclogenesis all summer, has only intensified during the past week. The ~20-30m/s upper tropospheric equatorial westerly wind flow anomalies across the Pacific downstream from the twin tropical cyclones appear to heading into central South America, apparently having limited local impact across the tropical Atlantic Ocean. This situation of AWB needs to change if additional true tropical cyclones are to develop in the Atlantic basin (above climatology). For the USA, the concern may have to focus on hybids like Gabrielle and Humberto.
The TNWP is probable to continue with a tropical cyclone hazard week 1 hopefully relaxing week 2. Impact areas include the Philippines north into at least Japan. There is evidence that the Eastern Hemisphere convection is starting to drift south, meaning locations from India into Southeast Asia are probable to continue with rounds of intense/severe thunderstorms through week 2. Finally, I can also see some concern for 1-2 strong/severe extratropical cyclones to slam at least northern Europe weeks 1-2.
Appendix
An experimental quasi-phase space plot of the GSDM utilizing a time series of normalized relative AAM tendency anomaly (Y-axis) and normalized relative AAM anomaly time series (X-axis) can be found at
http://www.cdc.noaa.gov/map/images/gcm/gsdm_95d.jpg
http://www.cdc.noaa.gov/map/images/gcm/gsdm_40d.jpg
http://www.cdc.noaa.gov/map/clim/gsdm.shtml
We call the behavior of this plot the Global Wind Oscillation (GWO). While the intent of the GSDM is to extend current thinking beyond the MJO, the purpose of the GWO is to illustrate the non-oscillatory stochastically forced component of the GSDM.
These are probabilistic statements, and work is ongoing to quantify in future posts (for example, risk assessment maps, signal to noise ratio plots and shifts of probability). We hope that an opportunity will arise for us to have a dedicated web page effort to expedite more objectively, with rigor, thoroughness and verification. The WB (2007) paper on the GSDM has been published in the February issue of MWR. I will try to post another discussion ~ 21 September.
Ed Berry
Saturday, September 08, 2007
Are we Sure???
The spatial distribution of global tropical SSTs has not changed too much since a week ago. There is a slightly anomalously warm (cool) Indian Ocean (Indonesia region) to significantly above average Tropical Northwest Pacific Ocean (TNWP) pattern across the Eastern Hemisphere. A horseshoe shape of anomalous warmth still extends into the extratropics from the latter. Starting around the date line all Nino regions appear to be cooler than normal per CPC 7 September 2007 daily mean SST analysis, with a tilt toward warmth from the Caribbean into the deep tropical Atlantic Ocean.
SST totals and anomalies from the west central into the northwest Pacific Ocean are in excess of 30C and plus 1 C over a large area. Negative SST anomalies of 1C and lower extend from ~160W to less than minus 2C ~110W per recent 5-day averaged TAO buoy data. All these anomalies are quite deep to at least 200-400 meters meaning a steeper than normal equatorial oceanic thermocline. So, at least for now our La-Nina has become an essentially basin wide event, having a pronounced westward shift since ~ 1 August forced by enhanced trades. In my past postings, I suggested the cool SSTs would be confined to the equatorial east Pacific Ocean. So far that appears to have been a poor assessment.
However, I do have what I think are fair concerns in regard to the future our developing cold event given ongoing subseasonal behaviors (discussed below). It is unfortunate that the resources are not (yet) presented to this effort which would allow weather-climate linkage risk assessment and probabilistic information (etc.) that may provide additional and useful predictive information. From speculation, I am concerned this La-Nina will peak during boreal fall; in a sense similar to El-Nino about a year ago (there has been a biennial character since ~2001). I will leave this path by again typing how interesting the weather-climate situation may become should the 30C and warmer waters of the west central Pacific Ocean become strongly convectively active by the start of 2008.
From full disk satellite imagery and other tools, there are 2 regions of tropical convective forcing across the Eastern Hemisphere. North equatorial Africa remains broadly active with periodic enhancement around the Americas. For the Eastern Hemisphere, one area is the stationary tropical signal centered ~10N/60-80E linked to the evolution of La-Nina discussed in my Labor Day Weekend postings. The TNWP forcing I think is another manifesting of the 20-30 day variability observed since around early June involving east and northward shifts. Even though recently updated RMM WH2004 phase space plots indicate some MJO projection with predicted eastward movement, I do not think the current TNWP flare-up is a result of MJO variability.
Since early June, the first couple were very weak MJOs while the last 2 I think have had an extratropical component of forcing. In fact, the most recent has involved a relatively strong positive global mountain torque of ~plus 30 Hadleys leading to a relative AAM tendency of similar magnitude just before 1 September. A circulation response has been for an increase of anomalous zonal mean westerly wind flow loosely from the equator to about 30N with magnitudes of 2-5m/s. There has even been a weak poleward propagation of anomalous zonal mean easterly wind flow from the equator to ~40N since about 10 August.
The most significant contribution to the most recent positive global mountain torque may have come from East Asia, but having nice dipole symmetry with the Southern Hemisphere due to the Andes Mountains. From daily monitoring of fields such animations of upper tropospheric daily mean vector wind anomalies, I can link extratropical Rossby wave energy dispersions (RWDs) tied to the Indian Ocean forcing to the positive global mountain torques. Subsequent dispersions into the TNWP enhancing upper tropospheric divergence led to the current observed flare-up in that region. These same animations suggest RWDs from the TWNP enhanced convection impacting the PNA sector as I type. A response has been for the GSDM Stage 2 response leading to a digging Rocky Mountain trough.
From a somewhat broader perspective, around 20 August we saw a poleward AAM transport signal maximized ~45N only to recently become directed equatorward ~35N. The interactions discussed above were involved in this reversal. When updated, the ESRL/PSD Global Wind Oscillation (GWO) quasi-phase space diagram should show an even larger circuit toward GSDM Stage 2, but still on the left hand side of the plot. Global relative AAM still remains low, ~ minus 2 Atmospheric Momentum Units (AMUs) below the R1 data climatology. Much of that contribution is still coming from the Southern Hemisphere equatorial and subtropical atmospheres. I think this will be the largest GWO circuit since the 2 large events during March and May 2007, having a contribution from non-MJO tropical convective forcing.
Finally, other roughly 20-30 day GWO circuits leading to at times 2 regions of tropical forcing across the Eastern Hemisphere may be probable going into boreal fall. These would likely involve both the Indian and west central Pacific Ocean basins. This is not a new concern on my end for numerous reasons, and any longer-term impacts on our La-Nina situation are unclear. However, monitoring is critical since numerical coupled ensemble prediction schemes are unlikely catch complicated subseasonal behaviors like GWOs until their impacts have already occurred.
For the USA week 1, the models have generally caught the GSDM Stage 2 response of the Rockies and Plains trough. Much of the country will have the first surge of autumn cool air, with the largest negative temperature anomalies generally focused on the Northern Plains and Upper Mississippi Valley. Heavy precipitation is likely to occur across locations such as from the Southern Plains into the eastern states. During weeks 2-3, the east Pacific Ridge-central states trough pattern should loose amplitude, with more troughs from the east Pacific into the western states becoming probable. The GWO should quickly orbit into the GSDM Stage 4-1 phase plane. Another “strong trough” situation may be probable for the Rockies and Plains ~ week 3. Again, predictability can be very low during transition seasons. Stay tuned if much of the western and central USA has a “real winter (assuming the Arctic Ocean freezes back over!)” with perhaps many GSDM Stage 4-1 situations per above.
Internationally, generally from the Indian Ocean into the TNWP periods of intense rainfall are probable week 1, including tropical cyclone activity across the latter. The focus should then shift back into the region of India into Southeast Asia and Southern China at least week 2, with still a tropical cyclone concern for the region around the Philippines. Northern equatorial Africa should stay convectively active for at least the next couple of weeks.
Please see the latest statements from the NOAA/NWS/Tropical Prediction Center for tropical cyclone statements. As discussed a week ago, Gabrielle developed as a hybrid system. I can see a scenario favoring tropical cyclone development perhaps even above climatology across the deep tropics of the Atlantic Ocean week 1 and possibly continuing week 2.
Appendix
An experimental quasi-phase space plot of the GSDM utilizing a time series of normalized relative AAM tendency anomaly (Y-axis) and normalized relative AAM anomaly time series (X-axis) can be found at
http://www.cdc.noaa.gov/map/images/gcm/gsdm_95d.jpg
http://www.cdc.noaa.gov/map/images/gcm/gsdm_40d.jpg
http://www.cdc.noaa.gov/map/clim/gsdm.shtml
We call the behavior of this plot the Global Wind Oscillation (GWO). While the intent of the GSDM is to extend current thinking beyond the MJO, the purpose of the GWO is to illustrate the non-oscillatory stochastically forced component of the GSDM.
These are probabilistic statements, and work is ongoing to quantify in future posts (for example, risk assessment maps, signal to noise ratio plots and shifts of probability). We hope that an opportunity will arise for us to have a dedicated web page effort to expedite more objectively, with rigor, thoroughness and verification. The WB (2007) paper on the GSDM has been published in the February issue of MWR. I will be on travel during the week of 10-14 September, and I am unclear when my next update will be.
Ed Berry
SST totals and anomalies from the west central into the northwest Pacific Ocean are in excess of 30C and plus 1 C over a large area. Negative SST anomalies of 1C and lower extend from ~160W to less than minus 2C ~110W per recent 5-day averaged TAO buoy data. All these anomalies are quite deep to at least 200-400 meters meaning a steeper than normal equatorial oceanic thermocline. So, at least for now our La-Nina has become an essentially basin wide event, having a pronounced westward shift since ~ 1 August forced by enhanced trades. In my past postings, I suggested the cool SSTs would be confined to the equatorial east Pacific Ocean. So far that appears to have been a poor assessment.
However, I do have what I think are fair concerns in regard to the future our developing cold event given ongoing subseasonal behaviors (discussed below). It is unfortunate that the resources are not (yet) presented to this effort which would allow weather-climate linkage risk assessment and probabilistic information (etc.) that may provide additional and useful predictive information. From speculation, I am concerned this La-Nina will peak during boreal fall; in a sense similar to El-Nino about a year ago (there has been a biennial character since ~2001). I will leave this path by again typing how interesting the weather-climate situation may become should the 30C and warmer waters of the west central Pacific Ocean become strongly convectively active by the start of 2008.
From full disk satellite imagery and other tools, there are 2 regions of tropical convective forcing across the Eastern Hemisphere. North equatorial Africa remains broadly active with periodic enhancement around the Americas. For the Eastern Hemisphere, one area is the stationary tropical signal centered ~10N/60-80E linked to the evolution of La-Nina discussed in my Labor Day Weekend postings. The TNWP forcing I think is another manifesting of the 20-30 day variability observed since around early June involving east and northward shifts. Even though recently updated RMM WH2004 phase space plots indicate some MJO projection with predicted eastward movement, I do not think the current TNWP flare-up is a result of MJO variability.
Since early June, the first couple were very weak MJOs while the last 2 I think have had an extratropical component of forcing. In fact, the most recent has involved a relatively strong positive global mountain torque of ~plus 30 Hadleys leading to a relative AAM tendency of similar magnitude just before 1 September. A circulation response has been for an increase of anomalous zonal mean westerly wind flow loosely from the equator to about 30N with magnitudes of 2-5m/s. There has even been a weak poleward propagation of anomalous zonal mean easterly wind flow from the equator to ~40N since about 10 August.
The most significant contribution to the most recent positive global mountain torque may have come from East Asia, but having nice dipole symmetry with the Southern Hemisphere due to the Andes Mountains. From daily monitoring of fields such animations of upper tropospheric daily mean vector wind anomalies, I can link extratropical Rossby wave energy dispersions (RWDs) tied to the Indian Ocean forcing to the positive global mountain torques. Subsequent dispersions into the TNWP enhancing upper tropospheric divergence led to the current observed flare-up in that region. These same animations suggest RWDs from the TWNP enhanced convection impacting the PNA sector as I type. A response has been for the GSDM Stage 2 response leading to a digging Rocky Mountain trough.
From a somewhat broader perspective, around 20 August we saw a poleward AAM transport signal maximized ~45N only to recently become directed equatorward ~35N. The interactions discussed above were involved in this reversal. When updated, the ESRL/PSD Global Wind Oscillation (GWO) quasi-phase space diagram should show an even larger circuit toward GSDM Stage 2, but still on the left hand side of the plot. Global relative AAM still remains low, ~ minus 2 Atmospheric Momentum Units (AMUs) below the R1 data climatology. Much of that contribution is still coming from the Southern Hemisphere equatorial and subtropical atmospheres. I think this will be the largest GWO circuit since the 2 large events during March and May 2007, having a contribution from non-MJO tropical convective forcing.
Finally, other roughly 20-30 day GWO circuits leading to at times 2 regions of tropical forcing across the Eastern Hemisphere may be probable going into boreal fall. These would likely involve both the Indian and west central Pacific Ocean basins. This is not a new concern on my end for numerous reasons, and any longer-term impacts on our La-Nina situation are unclear. However, monitoring is critical since numerical coupled ensemble prediction schemes are unlikely catch complicated subseasonal behaviors like GWOs until their impacts have already occurred.
For the USA week 1, the models have generally caught the GSDM Stage 2 response of the Rockies and Plains trough. Much of the country will have the first surge of autumn cool air, with the largest negative temperature anomalies generally focused on the Northern Plains and Upper Mississippi Valley. Heavy precipitation is likely to occur across locations such as from the Southern Plains into the eastern states. During weeks 2-3, the east Pacific Ridge-central states trough pattern should loose amplitude, with more troughs from the east Pacific into the western states becoming probable. The GWO should quickly orbit into the GSDM Stage 4-1 phase plane. Another “strong trough” situation may be probable for the Rockies and Plains ~ week 3. Again, predictability can be very low during transition seasons. Stay tuned if much of the western and central USA has a “real winter (assuming the Arctic Ocean freezes back over!)” with perhaps many GSDM Stage 4-1 situations per above.
Internationally, generally from the Indian Ocean into the TNWP periods of intense rainfall are probable week 1, including tropical cyclone activity across the latter. The focus should then shift back into the region of India into Southeast Asia and Southern China at least week 2, with still a tropical cyclone concern for the region around the Philippines. Northern equatorial Africa should stay convectively active for at least the next couple of weeks.
Please see the latest statements from the NOAA/NWS/Tropical Prediction Center for tropical cyclone statements. As discussed a week ago, Gabrielle developed as a hybrid system. I can see a scenario favoring tropical cyclone development perhaps even above climatology across the deep tropics of the Atlantic Ocean week 1 and possibly continuing week 2.
Appendix
An experimental quasi-phase space plot of the GSDM utilizing a time series of normalized relative AAM tendency anomaly (Y-axis) and normalized relative AAM anomaly time series (X-axis) can be found at
http://www.cdc.noaa.gov/map/images/gcm/gsdm_95d.jpg
http://www.cdc.noaa.gov/map/images/gcm/gsdm_40d.jpg
http://www.cdc.noaa.gov/map/clim/gsdm.shtml
We call the behavior of this plot the Global Wind Oscillation (GWO). While the intent of the GSDM is to extend current thinking beyond the MJO, the purpose of the GWO is to illustrate the non-oscillatory stochastically forced component of the GSDM.
These are probabilistic statements, and work is ongoing to quantify in future posts (for example, risk assessment maps, signal to noise ratio plots and shifts of probability). We hope that an opportunity will arise for us to have a dedicated web page effort to expedite more objectively, with rigor, thoroughness and verification. The WB (2007) paper on the GSDM has been published in the February issue of MWR. I will be on travel during the week of 10-14 September, and I am unclear when my next update will be.
Ed Berry
Monday, September 03, 2007
Short
Since it unlikely I will not be able to write another posting until (hopefully) next weekend (8-9 September), I thought to do a brief update. There is no change to my reasoning I discussed on 1 September. The spatial pattern of global tropical SSTs supports the possibility of a coupled ocean-atmosphere La-Nina response through at least boreal fall into early winter. Hence the continuation of a low AAM GSDM Stage 1 circulation is most probable.
The dominate global tropical convective forcing has loosely consolidated ~10N/80-90E, per monitoring tools such as full disk satellite imagery and various Hovmoller plots. There is some evidence of another east-northeast shift of the tropical forcing toward western Indonesia and Southeast Asia. I think this movement is a bit farther south than the past 3. However, another burst of strong convection is developing back to the west ~0/60E, illustrating the stationary character of our atmospheric base state.
Global relative AAM tendency has spiked to ~plus 30 Hadleys per R1 data plots through 31 August, and much of that appears to be driven by a decent global mountain torque (also ~plus 30 Hadleys). There also appears to be an equatorial contribution to this positive AAM tendency, perhaps linked with a weak west central Pacific tropical convective flare-up. Bottom line is I think we are having another perturbation to our GSDM Stage 1 regime forced by the global mountain torque and the weak eastward movement of the tropical convection discussed above. When updated, this will be observed as another circuit in GWO quasi-phase space well on the left hand side of the ESRL/PSD plot, similar to the event roughly a couple of weeks ago.
Trough development from the Rockies into the Plains for week 1 is a good bet. A closed low may anticyclonically wave break (AWB; probable to occur during a GSDM Stage 1 base state) across the central Rockies later this week before shifting northeast toward the Great Lakes. I still like the notion of a stronger and colder trough for the Rockies and Plains week 2. However, throughout this upcoming fall the polar jet stream westerlies may remain farther north on average than climatology across North America given our GSDM Stage 1 circulation. Western/central USA troughs may be a function of brief upward GWO orbits. By around mid-late November into December the seasonal cycle contribution may allow a more persistent and at times highly amplified negative phase of the Pacific-North American teleconnection (favoring anomalously strong western USA troughs). WB (2007) has already showed that the latter is probable during GSDM Stage 1 situations for the period of November-March. I hope we can formally illustrate these kinds of concepts much more objectively with signal to noise ratio plots and risk assessment maps for a period such as December-February (DJF).
The outlook internationally is unchanged from 1 September. A modification may be for a somewhat more active Tropical Northwest Pacific Ocean in the region of the South China Sea per above later this week into week 2. Please see the latest statements from the NOAA/NWS/Tropical Prediction Center for tropical cyclone information. The inability of Hurricane Dean and thus far Hurricane Felix to exhibit much of a northward movement from the deep tropical Atlantic Ocean is a result of the persistent anomalous zonal mean easterly wind flow throughout the tropical atmosphere. I still see quite a bit of AWB activity across the North Atlantic Ocean allowing penetration of stable airmasses from the higher latitudes into the tropics. In fact, Gabrielle may be the result of a hybrid frontal wave development off the USA east coast per some models.
Appendix
An experimental quasi-phase space plot of the GSDM utilizing a time series of normalized relative AAM tendency anomaly (Y-axis) and normalized relative AAM anomaly time series (X-axis) can be found at
http://www.cdc.noaa.gov/map/images/gcm/gsdm_95d.jpg
http://www.cdc.noaa.gov/map/images/gcm/gsdm_40d.jpg
http://www.cdc.noaa.gov/map/clim/gsdm.shtml
We call the behavior of this plot the Global Wind Oscillation (GWO). While the intent of the GSDM is to extend current thinking beyond the MJO, the purpose of the GWO is to illustrate the non-oscillatory stochastically forced component of the GSDM.
These are probabilistic statements, and work is ongoing to quantify in future posts (for example, risk assessment maps, signal to noise ratio plots and shifts of probability). We hope that an opportunity will arise for us to have a dedicated web page effort to expedite more objectively, with rigor, thoroughness and verification. The WB (2007) paper on the GSDM has been published in the February issue of MWR. I will try to post an update during the weekend of 8-9 September.
Ed Berry
The dominate global tropical convective forcing has loosely consolidated ~10N/80-90E, per monitoring tools such as full disk satellite imagery and various Hovmoller plots. There is some evidence of another east-northeast shift of the tropical forcing toward western Indonesia and Southeast Asia. I think this movement is a bit farther south than the past 3. However, another burst of strong convection is developing back to the west ~0/60E, illustrating the stationary character of our atmospheric base state.
Global relative AAM tendency has spiked to ~plus 30 Hadleys per R1 data plots through 31 August, and much of that appears to be driven by a decent global mountain torque (also ~plus 30 Hadleys). There also appears to be an equatorial contribution to this positive AAM tendency, perhaps linked with a weak west central Pacific tropical convective flare-up. Bottom line is I think we are having another perturbation to our GSDM Stage 1 regime forced by the global mountain torque and the weak eastward movement of the tropical convection discussed above. When updated, this will be observed as another circuit in GWO quasi-phase space well on the left hand side of the ESRL/PSD plot, similar to the event roughly a couple of weeks ago.
Trough development from the Rockies into the Plains for week 1 is a good bet. A closed low may anticyclonically wave break (AWB; probable to occur during a GSDM Stage 1 base state) across the central Rockies later this week before shifting northeast toward the Great Lakes. I still like the notion of a stronger and colder trough for the Rockies and Plains week 2. However, throughout this upcoming fall the polar jet stream westerlies may remain farther north on average than climatology across North America given our GSDM Stage 1 circulation. Western/central USA troughs may be a function of brief upward GWO orbits. By around mid-late November into December the seasonal cycle contribution may allow a more persistent and at times highly amplified negative phase of the Pacific-North American teleconnection (favoring anomalously strong western USA troughs). WB (2007) has already showed that the latter is probable during GSDM Stage 1 situations for the period of November-March. I hope we can formally illustrate these kinds of concepts much more objectively with signal to noise ratio plots and risk assessment maps for a period such as December-February (DJF).
The outlook internationally is unchanged from 1 September. A modification may be for a somewhat more active Tropical Northwest Pacific Ocean in the region of the South China Sea per above later this week into week 2. Please see the latest statements from the NOAA/NWS/Tropical Prediction Center for tropical cyclone information. The inability of Hurricane Dean and thus far Hurricane Felix to exhibit much of a northward movement from the deep tropical Atlantic Ocean is a result of the persistent anomalous zonal mean easterly wind flow throughout the tropical atmosphere. I still see quite a bit of AWB activity across the North Atlantic Ocean allowing penetration of stable airmasses from the higher latitudes into the tropics. In fact, Gabrielle may be the result of a hybrid frontal wave development off the USA east coast per some models.
Appendix
An experimental quasi-phase space plot of the GSDM utilizing a time series of normalized relative AAM tendency anomaly (Y-axis) and normalized relative AAM anomaly time series (X-axis) can be found at
http://www.cdc.noaa.gov/map/images/gcm/gsdm_95d.jpg
http://www.cdc.noaa.gov/map/images/gcm/gsdm_40d.jpg
http://www.cdc.noaa.gov/map/clim/gsdm.shtml
We call the behavior of this plot the Global Wind Oscillation (GWO). While the intent of the GSDM is to extend current thinking beyond the MJO, the purpose of the GWO is to illustrate the non-oscillatory stochastically forced component of the GSDM.
These are probabilistic statements, and work is ongoing to quantify in future posts (for example, risk assessment maps, signal to noise ratio plots and shifts of probability). We hope that an opportunity will arise for us to have a dedicated web page effort to expedite more objectively, with rigor, thoroughness and verification. The WB (2007) paper on the GSDM has been published in the February issue of MWR. I will try to post an update during the weekend of 8-9 September.
Ed Berry
Saturday, September 01, 2007
To be, or not to be La-Nina
Per NOAA/CPC SST plots and NOAA/PMEL/TAO buoy data; global tropical SSTs are slightly warmer than average across the Indian Ocean while significantly above normal across much of the west Pacific Ocean warm pool. Anomalies and totals are around plus 0.5-1C and 28-29C for the former and ~plus 1-2C and greater than 30C in region of 5-10N and 150E. Cooler than normal SSTs have become more coherent spatially across the equatorial central and east Pacific east of the date line, with anomalies as low as less than minus 2C ~100-120W extending to depths ~200m. Given that the seasonal cycle favors cooling, these anomalies are not trivial. The Caribbean into the tropical Atlantic Ocean remains near to slightly warmer than climatology.
So, is La-Nina becoming better defined? As stated previously, the global circulation is strongly La-Nina like with global relative AAM currently ~3-4 Atmospheric Momentum Units (AMUs ) below the R1 data climatology while the SSTs have only weakly supported that response. Since about January 2007 Hovmoller plots of OLR/A show a nice signal of tropical convective forcing consolidating across the Eastern Hemisphere ~90-120E. There were 3 weak northeastward propagating subseasonal (~20 to 30-day) variations (weaker in succession) of this tropical forcing since about 1 June. I even speculate that this whole situation started ~ 1 December 2006 when dynamical feedbacks from the atmosphere put the “kibosh” on what was supposed to be a basin-wide warm event. The atmosphere has since been trending toward La-Nina, seemingly followed by the tropical convective response and maybe finally the SSTs. There has been a surge of above normal trades during the last couple of weeks as a response to the Eastern Hemisphere tropical convection helping to cool the SSTs across the Nino regions.
At this point I think La-Nina circulation conditions (GSDM Stage 1) are highly probable through boreal fall into at least early winter (DJF). However, suppression across the west central Pacific Ocean is only going to favor expanding warmth west of the date line. These warm anomalies are also probable to remain very deep, to at least 400m. It will be interesting monitoring the tropical convective forcing this winter as the seasonal cycle makes its contribution. In the meantime, going into the boreal cool season the odds may slightly tilt toward a significant cold regime at times, focusing on the western 2/3rds of North America along with an active southwest flow storm track across the USA Plains.
GSDM Stage 1 continues to reign supreme. Full disk satellite imagery present a nice signal of tropical convective forcing centered ~10N/100E, with some enhancement across north equatorial Africa and flare-ups around the Americas and Tropical Northwest Pacific (on-going tropical cyclones understood). Animations of daily mean upper tropospheric vector wind anomalies show an emerging response of twin tropical/subtropical anticyclones ~90E with compensating cyclones just east of the date line. In fact, the combined distribution of anomalous tropical easterlies from the Indian Ocean into the Africa, westerly wind flow anomalies just east of the date line and OLRA have led to a decent MJO projection per Wheeler and Hendon (2004) phase space plots. A coherent Rossby wave energy dispersion from this tropical forcing and circulation response nicely hooks up with yet another sickening wicked Devil ridge across the western and central USA (even in a weekly mean).
As discussed above, global relative AAM is ~3-4 AMUs below the R1 data climatology. Much of that signal is still coming from strongly anomalous deep zonal mean easterly wind flow across the Southern Hemisphere tropical atmosphere with, for instance, ~5-10m/s magnitudes at 200mb. The last subseasonal event of tropical forcing did allow some of the anomalous zonal mean easterly wind flow to propagate off the equator into the northern subtropics to ~30N. In fact, even weak zonal mean westerly wind anomalies have appeared ~15N. I think what the RMM plots are showing as a MJO is in reality another 20-30-day subseasonal variation similar to the past 3. As of 30 August the global mountain torque has spiked to ~plus 30 Hadleys contributing to the plus 20 Hadley AAM tendency. I think there will be another orbit in GWO quasi-phase space just like that seen about 10-15 days ago. In other words, another perturbation onto the GSDM Stage 1 base state is probable during the next couple weeks.
For the Pacific-North American sector the above reasoning suggests an eastward shift of the coherent Rossby wave train already discussed. My own feeling would be for at least a couple of troughs to dig into the western USA, with the strongest during week 2. This pattern should then shift east and decay in amplitude, particularly in the presence of seasonal transition to fall. Hence a trend toward cooler and wetter is probable for the west and central USA, perhaps targeting the northern and central Plains week 2. Numerical ensemble prediction schemes from international weather centers are coming into better agreement on this notion, which was first suggested in my posting about a week ago for this forecast period. It is likely deep tropical moisture transport from both the east Pacific and Caribbean will be involved with these precipitation events. Locations around Alaska are going to be “close” to the amplifying ridge ~140-160W. However, storms coming off of East Asia are probable to impact that state weeks 2-3.
Please see the latest statements from the NOAA/NWS/Tropical Prediction Center for tropical cyclone statements. I still see quite a bit of anticyclonic wave breaking activity across the North Atlantic Ocean allowing penetration of stable airmasses from the higher latitudes into the tropics. However, easterly wave activity is quite robust over Africa tied to an anomalously strong Tropical Easterly Jet, and there may be a couple of opportunities for hybrid systems to develop close to the USA during the next 2-3 weeks. In fact, what could become Gabrielle (Xena’s sidekick?) during the next few days may be currently festering midway between Africa and the Lesser Antilles.
Locations from the central and eastern equatorial Indian Ocean and India into China and Southeast Asia still appear likely to continue with the poundings of intense monsoon/frontal band rainfall this week into week 2. Perhaps the upcoming subseasonal event will be the last northward shift for this boreal summer. With the exception of Typhoon Fitow, much of the west central and northwest Pacific should have generally suppressed conditions for at least week 1. Equatorial North Africa should remain active for at least week 1 and perhaps a few more.
Appendix
An experimental quasi-phase space plot of the GSDM utilizing a time series of normalized relative AAM tendency anomaly (Y-axis) and normalized relative AAM anomaly time series (X-axis) can be found at
http://www.cdc.noaa.gov/map/images/gcm/gsdm_95d.jpg
http://www.cdc.noaa.gov/map/images/gcm/gsdm_40d.jpg
http://www.cdc.noaa.gov/map/clim/gsdm.shtml
We call the behavior of this plot the Global Wind Oscillation (GWO). While the intent of the GSDM is to extend current thinking beyond the MJO, the purpose of the GWO is to illustrate the non-oscillatory stochastically forced component of the GSDM.
These are probabilistic statements, and work is ongoing to quantify in future posts (for example, risk assessment maps, signal to noise ratio plots and shifts of probability). We hope that an opportunity will arise for us to have a dedicated web page effort to expedite more objectively, with rigor, thoroughness and verification. The WB (2007) paper on the GSDM has been published in the February issue of MWR. I will try to post a short update during roughly the middle of next week.
Ed Berry
So, is La-Nina becoming better defined? As stated previously, the global circulation is strongly La-Nina like with global relative AAM currently ~3-4 Atmospheric Momentum Units (AMUs ) below the R1 data climatology while the SSTs have only weakly supported that response. Since about January 2007 Hovmoller plots of OLR/A show a nice signal of tropical convective forcing consolidating across the Eastern Hemisphere ~90-120E. There were 3 weak northeastward propagating subseasonal (~20 to 30-day) variations (weaker in succession) of this tropical forcing since about 1 June. I even speculate that this whole situation started ~ 1 December 2006 when dynamical feedbacks from the atmosphere put the “kibosh” on what was supposed to be a basin-wide warm event. The atmosphere has since been trending toward La-Nina, seemingly followed by the tropical convective response and maybe finally the SSTs. There has been a surge of above normal trades during the last couple of weeks as a response to the Eastern Hemisphere tropical convection helping to cool the SSTs across the Nino regions.
At this point I think La-Nina circulation conditions (GSDM Stage 1) are highly probable through boreal fall into at least early winter (DJF). However, suppression across the west central Pacific Ocean is only going to favor expanding warmth west of the date line. These warm anomalies are also probable to remain very deep, to at least 400m. It will be interesting monitoring the tropical convective forcing this winter as the seasonal cycle makes its contribution. In the meantime, going into the boreal cool season the odds may slightly tilt toward a significant cold regime at times, focusing on the western 2/3rds of North America along with an active southwest flow storm track across the USA Plains.
GSDM Stage 1 continues to reign supreme. Full disk satellite imagery present a nice signal of tropical convective forcing centered ~10N/100E, with some enhancement across north equatorial Africa and flare-ups around the Americas and Tropical Northwest Pacific (on-going tropical cyclones understood). Animations of daily mean upper tropospheric vector wind anomalies show an emerging response of twin tropical/subtropical anticyclones ~90E with compensating cyclones just east of the date line. In fact, the combined distribution of anomalous tropical easterlies from the Indian Ocean into the Africa, westerly wind flow anomalies just east of the date line and OLRA have led to a decent MJO projection per Wheeler and Hendon (2004) phase space plots. A coherent Rossby wave energy dispersion from this tropical forcing and circulation response nicely hooks up with yet another sickening wicked Devil ridge across the western and central USA (even in a weekly mean).
As discussed above, global relative AAM is ~3-4 AMUs below the R1 data climatology. Much of that signal is still coming from strongly anomalous deep zonal mean easterly wind flow across the Southern Hemisphere tropical atmosphere with, for instance, ~5-10m/s magnitudes at 200mb. The last subseasonal event of tropical forcing did allow some of the anomalous zonal mean easterly wind flow to propagate off the equator into the northern subtropics to ~30N. In fact, even weak zonal mean westerly wind anomalies have appeared ~15N. I think what the RMM plots are showing as a MJO is in reality another 20-30-day subseasonal variation similar to the past 3. As of 30 August the global mountain torque has spiked to ~plus 30 Hadleys contributing to the plus 20 Hadley AAM tendency. I think there will be another orbit in GWO quasi-phase space just like that seen about 10-15 days ago. In other words, another perturbation onto the GSDM Stage 1 base state is probable during the next couple weeks.
For the Pacific-North American sector the above reasoning suggests an eastward shift of the coherent Rossby wave train already discussed. My own feeling would be for at least a couple of troughs to dig into the western USA, with the strongest during week 2. This pattern should then shift east and decay in amplitude, particularly in the presence of seasonal transition to fall. Hence a trend toward cooler and wetter is probable for the west and central USA, perhaps targeting the northern and central Plains week 2. Numerical ensemble prediction schemes from international weather centers are coming into better agreement on this notion, which was first suggested in my posting about a week ago for this forecast period. It is likely deep tropical moisture transport from both the east Pacific and Caribbean will be involved with these precipitation events. Locations around Alaska are going to be “close” to the amplifying ridge ~140-160W. However, storms coming off of East Asia are probable to impact that state weeks 2-3.
Please see the latest statements from the NOAA/NWS/Tropical Prediction Center for tropical cyclone statements. I still see quite a bit of anticyclonic wave breaking activity across the North Atlantic Ocean allowing penetration of stable airmasses from the higher latitudes into the tropics. However, easterly wave activity is quite robust over Africa tied to an anomalously strong Tropical Easterly Jet, and there may be a couple of opportunities for hybrid systems to develop close to the USA during the next 2-3 weeks. In fact, what could become Gabrielle (Xena’s sidekick?) during the next few days may be currently festering midway between Africa and the Lesser Antilles.
Locations from the central and eastern equatorial Indian Ocean and India into China and Southeast Asia still appear likely to continue with the poundings of intense monsoon/frontal band rainfall this week into week 2. Perhaps the upcoming subseasonal event will be the last northward shift for this boreal summer. With the exception of Typhoon Fitow, much of the west central and northwest Pacific should have generally suppressed conditions for at least week 1. Equatorial North Africa should remain active for at least week 1 and perhaps a few more.
Appendix
An experimental quasi-phase space plot of the GSDM utilizing a time series of normalized relative AAM tendency anomaly (Y-axis) and normalized relative AAM anomaly time series (X-axis) can be found at
http://www.cdc.noaa.gov/map/images/gcm/gsdm_95d.jpg
http://www.cdc.noaa.gov/map/images/gcm/gsdm_40d.jpg
http://www.cdc.noaa.gov/map/clim/gsdm.shtml
We call the behavior of this plot the Global Wind Oscillation (GWO). While the intent of the GSDM is to extend current thinking beyond the MJO, the purpose of the GWO is to illustrate the non-oscillatory stochastically forced component of the GSDM.
These are probabilistic statements, and work is ongoing to quantify in future posts (for example, risk assessment maps, signal to noise ratio plots and shifts of probability). We hope that an opportunity will arise for us to have a dedicated web page effort to expedite more objectively, with rigor, thoroughness and verification. The WB (2007) paper on the GSDM has been published in the February issue of MWR. I will try to post a short update during roughly the middle of next week.
Ed Berry
Sunday, August 26, 2007
Atmosphere Remains Slow
Note: The ESRL/PSD NCEP/NCAR Reanalysis-1 data (R1) AAM plots now present the “complete” budget (updated through 24 August as of this writing), and will be referred to.
Per NOAA/CPC and NOAA/PMEL/TAO buoy data; the overall spatial distribution of global tropical SSTs has not changed much for at least several weeks. The equatorial Indian Ocean and particularly the west central and northwest Pacific Ocean basins (with the horseshoe into the subtropics/midlatitudes) remain well above climatology. Anomaly magnitudes are ~1-1.5 deg C with the former and up to 2 deg C for the latter, with totals in excess of 30 deg C along the equator near 150E. The west Pacific Ocean anomalies are deep extending to at least 400m, suggesting an anomalously warm west Pacific Ocean warm pool.
The negative SST anomalies across the equatorial East Pacific cold tongue have weakened slightly during the past week, with recent 5-day averaged values varying from ~.5C just east of the date line to around 2C near 120W (~Nino 3). The cool anomalies still extend to around 150-200m deep in the region of 140-160W, but with values ~minus 2-2.5C at 150m/150W. It will be interesting to monitor the persistence of these anomalies going into boreal fall since the seasonal cycle favors cooling. The equatorial Atlantic Ocean and the Caribbean Sea have slightly positive SST anomalies with cool pockets inter-dispersed. Totals range from 27-28C across the former to in excess of 29C for the latter.
Again, while the global circulation is strongly La-Nina like (GSDM Stage 1), the SSTs only weakly support that response. To me, the seasonal transition to boreal fall may give us some insight whether or not the SSTs become more La-Nina like, or if a different evolution occurs. For example, the South Asian monsoon system will shut down and the Eastern Hemisphere tropical convective forcing will shift south. How will a possibly coupled system respond should, for example, MJO activity increase?
The strongest tropical convective forcing is still across the Eastern Hemisphere, centered ~10-15N/90-100E per full disk satellite imagery. From time-latitude sections of OLR/A and daily monitoring, this activity has been shifting northeast off the equator during the past week. Currently enhanced rainfall extends from northern India east-southeast into the far west Pacific Ocean. This is the third (but weak) event of this nature since about June, and is typical during boreal summer. As discussed below, the region of tropical thunderstorm clusters actually represents a weak consolidation. Other enhanced activity is occurring around the Americas and north equatorial Africa. The Wheeler and Hendon (2004) multivariate RMM phase space plots from several international weather centers generally suggest a ~1 standard deviation MJO projection across the Indian Ocean (more said below).
Since at least mid-August, relatively “well-orchestrated” Rossby wave energy dispersions (RWDs) linked to the Indian Ocean/South Asian monsoon system tropical forcing have been propagating into the Tropical Northwest Pacific Ocean (TNWP). A tropical convective flare-up over the TNWP occurred early last week, moving west and linking with the clusters farther west. However, to be brief, monitoring tells me this chain of events allowed circulation anomalies to impinge upon global north-south mountain massifs driving the mountain torque to ~plus 20 Hadleys on about 18 August. Along with a positive global frictional torque, the global relative atmospheric angular momentum (AAM ) tendency spiked to slightly greater than 20 Hadleys. Since then, the global mountain torque and relative AAM tendency have collapsed to less than minus 20 Hadleys.
The point is I think a weak mountain-frictional torque index cycle variation has occurred during the last 7-10 days within our low AAM base state. When updated, the ESRL/PSD Global Wind Oscillation (GWO) quasi-phase space plot should present a weak circuit in the direction GSDM Stage 2, before heading “down”. This notion was offered as a possibility in my posting a week ago. Some westerly wind flow has been added to both the northern subtropical and midlatitude atmospheres, and will contribute to a Stage-2 like response across the PNA sector this upcoming week.
Global total and relative AAM remain extremely low, less than 3 atmospheric momentum units (AMUs) below the R1 data climatology (at least 2.5 standard deviations) through 24 August. Deep zonal mean easterly wind anomalies still dominate much of the tropical atmosphere, with the largest magnitudes now just south of the equator near 5S (~10 m/s at 200mb). Worth repeating, the cause of this extremely low AAM, GSDM Stage 1 regime is unclear. I can speculate this all goes back to dynamical forcing-response feedback processes linked to AAM transports and large GWO circuits that started ~ 1 December 2006, when El-Nino was “stopped in its tracks”. In any event, the SSTs themselves do not support this global circulation. The intense zonal mean easterly wind anomalies have been broadening in latitude into the subtropical atmospheres of both hemispheres during the last several weeks. There is still little evidence for these zonal mean easterly wind anomalies to propagate off the equator. Daily monitoring of if/when these zonal mean easterlies do propagate poleward off the equator is critical to determining the most probable future global circulation state. I make a plea to having a diagnostic tool such as the baroclinic CHI problem to see what is going on vertically.
Animations of upper tropospheric daily mean vector wind total/anomaly fields give a loose signal of twin anticyclones ~90E with downstream very weak cyclones just east of the date line. Cross equatorial flow from the Southern Hemisphere remains robust in the region of the date line. In fact, I speculate that the intense RWDs across the Southern Hemisphere leading to this cross equatorial flow may be forcing the zonal mean anomalous easterlies closer to the equator as a feedback.
In any case, there has also been episodic (~every 3-5 days) meridional-zonal-meriodional northeast-southwest (northwest-southeast for the Southern Hemisphere) vacillations of the midlatitude synoptic eddies over the past couple of weeks. It is not unusual to observe this type of behavior during strong GSDM Stage 1 situations. Most importantly, for the first time in at least a couple of months a relatively strong inter-hemispheric symmetric AAM transport signal has appeared. The signal is most robust ~50N and 40S. Hence there is the possibility of a stronger positive mountain-frictional torque index cycle than recently observed over the next couple of weeks.
If there is any truth to the RMM predictions of a weak MJO also during the next couple of weeks, perhaps a larger circuit in GWO quasi-phase space toward Stage 2 will occur. However, this is all speculation, and I do expect an overall GSDM Stage 1 regime to persist until further notice. Only those who do rigorous daily weather-climate monitoring utilizing the GSDM will be the first to catch any kind of a rapid change. It is unlikely any multi-model ensemble prediction scheme will catch an abrupt subseasonal change “until it happens (like ~1 December 2006)”. We also need to remember that predictability with any technique/forecast process is generally quite low during seasonal transitions, which we are about to experience.
There is some model agreement for progressive troughs and ridges across the USA during the next few weeks as seasonal strengthening of the westerlies occur. After this upcoming week’s central/eastern USA trough, I offer a low probability of a stronger event having a Rockies-Plains trough later week 2 into week 3 (~ 7-16 September?). Weather ramifications should be apparent, including the first possible snowfall across the Northern Rockies and an increased likelihood of storminess across the Plains.
In the longer term, should this low AAM regime persist through boreal winter, much of the USA focusing on the western USA into the Plains may have the odds tilted toward a cold and stormy pattern (western trough/southeast states ridge), if there is an Arctic cold air source. Per above, stay tuned.
It is obviously unclear to say where any possible land falling tropical cyclone will go. However, please see the latest statements from the NOAA/NWS/Tropical Prediction Center. At least for week 1, once again relatively stable air is penetrating the deep Tropical North Atlantic Ocean (TNA) basin. Thus tropical cyclone activity for at least the TNA may be suppressed this upcoming week (understanding hybrids and what can occur across the Caribbean).
Locations from the central and eastern equatorial Indian Ocean into China and Southeast Asia are likely to continue with the poundings of intense monsoon rainfall for at least this week into possibly week 2. Perhaps the recent northward shift discussed above may be the last for boreal summer. The likelihood of severe thunderstorms including tropical cyclone activity across the TNWP including the Philippines may increase by week 2. Equatorial North Africa may remain active for at least week 1.
Appendix
An experimental quasi-phase space plot of the GSDM utilizing a time series of normalized relative AAM tendency anomaly (Y-axis) and normalized relative AAM anomaly time series (X-axis) can be found at
http://www.cdc.noaa.gov/map/images/gcm/gsdm_95d.jpg
http://www.cdc.noaa.gov/map/images/gcm/gsdm_40d.jpg
http://www.cdc.noaa.gov/map/clim/gsdm.shtml
We call the behavior of this plot the Global Wind Oscillation (GWO). While the intent of the GSDM is to extend current thinking beyond the MJO, the purpose of the GWO is to illustrate the non-oscillatory component of the GSDM.
These are probabilistic statements, and work is ongoing to quantify in future posts (for example, risk assessment maps and signal to noise ratio plots). We hope that an opportunity will arise for us to have a dedicated web page effort to expedite more objectively, with rigor, thoroughness and verification. The WB (2007) paper on the GSDM has been published in the February issue of MWR. I will try to post an update on about Friday, 31 August.
Ed Berry
Per NOAA/CPC and NOAA/PMEL/TAO buoy data; the overall spatial distribution of global tropical SSTs has not changed much for at least several weeks. The equatorial Indian Ocean and particularly the west central and northwest Pacific Ocean basins (with the horseshoe into the subtropics/midlatitudes) remain well above climatology. Anomaly magnitudes are ~1-1.5 deg C with the former and up to 2 deg C for the latter, with totals in excess of 30 deg C along the equator near 150E. The west Pacific Ocean anomalies are deep extending to at least 400m, suggesting an anomalously warm west Pacific Ocean warm pool.
The negative SST anomalies across the equatorial East Pacific cold tongue have weakened slightly during the past week, with recent 5-day averaged values varying from ~.5C just east of the date line to around 2C near 120W (~Nino 3). The cool anomalies still extend to around 150-200m deep in the region of 140-160W, but with values ~minus 2-2.5C at 150m/150W. It will be interesting to monitor the persistence of these anomalies going into boreal fall since the seasonal cycle favors cooling. The equatorial Atlantic Ocean and the Caribbean Sea have slightly positive SST anomalies with cool pockets inter-dispersed. Totals range from 27-28C across the former to in excess of 29C for the latter.
Again, while the global circulation is strongly La-Nina like (GSDM Stage 1), the SSTs only weakly support that response. To me, the seasonal transition to boreal fall may give us some insight whether or not the SSTs become more La-Nina like, or if a different evolution occurs. For example, the South Asian monsoon system will shut down and the Eastern Hemisphere tropical convective forcing will shift south. How will a possibly coupled system respond should, for example, MJO activity increase?
The strongest tropical convective forcing is still across the Eastern Hemisphere, centered ~10-15N/90-100E per full disk satellite imagery. From time-latitude sections of OLR/A and daily monitoring, this activity has been shifting northeast off the equator during the past week. Currently enhanced rainfall extends from northern India east-southeast into the far west Pacific Ocean. This is the third (but weak) event of this nature since about June, and is typical during boreal summer. As discussed below, the region of tropical thunderstorm clusters actually represents a weak consolidation. Other enhanced activity is occurring around the Americas and north equatorial Africa. The Wheeler and Hendon (2004) multivariate RMM phase space plots from several international weather centers generally suggest a ~1 standard deviation MJO projection across the Indian Ocean (more said below).
Since at least mid-August, relatively “well-orchestrated” Rossby wave energy dispersions (RWDs) linked to the Indian Ocean/South Asian monsoon system tropical forcing have been propagating into the Tropical Northwest Pacific Ocean (TNWP). A tropical convective flare-up over the TNWP occurred early last week, moving west and linking with the clusters farther west. However, to be brief, monitoring tells me this chain of events allowed circulation anomalies to impinge upon global north-south mountain massifs driving the mountain torque to ~plus 20 Hadleys on about 18 August. Along with a positive global frictional torque, the global relative atmospheric angular momentum (AAM ) tendency spiked to slightly greater than 20 Hadleys. Since then, the global mountain torque and relative AAM tendency have collapsed to less than minus 20 Hadleys.
The point is I think a weak mountain-frictional torque index cycle variation has occurred during the last 7-10 days within our low AAM base state. When updated, the ESRL/PSD Global Wind Oscillation (GWO) quasi-phase space plot should present a weak circuit in the direction GSDM Stage 2, before heading “down”. This notion was offered as a possibility in my posting a week ago. Some westerly wind flow has been added to both the northern subtropical and midlatitude atmospheres, and will contribute to a Stage-2 like response across the PNA sector this upcoming week.
Global total and relative AAM remain extremely low, less than 3 atmospheric momentum units (AMUs) below the R1 data climatology (at least 2.5 standard deviations) through 24 August. Deep zonal mean easterly wind anomalies still dominate much of the tropical atmosphere, with the largest magnitudes now just south of the equator near 5S (~10 m/s at 200mb). Worth repeating, the cause of this extremely low AAM, GSDM Stage 1 regime is unclear. I can speculate this all goes back to dynamical forcing-response feedback processes linked to AAM transports and large GWO circuits that started ~ 1 December 2006, when El-Nino was “stopped in its tracks”. In any event, the SSTs themselves do not support this global circulation. The intense zonal mean easterly wind anomalies have been broadening in latitude into the subtropical atmospheres of both hemispheres during the last several weeks. There is still little evidence for these zonal mean easterly wind anomalies to propagate off the equator. Daily monitoring of if/when these zonal mean easterlies do propagate poleward off the equator is critical to determining the most probable future global circulation state. I make a plea to having a diagnostic tool such as the baroclinic CHI problem to see what is going on vertically.
Animations of upper tropospheric daily mean vector wind total/anomaly fields give a loose signal of twin anticyclones ~90E with downstream very weak cyclones just east of the date line. Cross equatorial flow from the Southern Hemisphere remains robust in the region of the date line. In fact, I speculate that the intense RWDs across the Southern Hemisphere leading to this cross equatorial flow may be forcing the zonal mean anomalous easterlies closer to the equator as a feedback.
In any case, there has also been episodic (~every 3-5 days) meridional-zonal-meriodional northeast-southwest (northwest-southeast for the Southern Hemisphere) vacillations of the midlatitude synoptic eddies over the past couple of weeks. It is not unusual to observe this type of behavior during strong GSDM Stage 1 situations. Most importantly, for the first time in at least a couple of months a relatively strong inter-hemispheric symmetric AAM transport signal has appeared. The signal is most robust ~50N and 40S. Hence there is the possibility of a stronger positive mountain-frictional torque index cycle than recently observed over the next couple of weeks.
If there is any truth to the RMM predictions of a weak MJO also during the next couple of weeks, perhaps a larger circuit in GWO quasi-phase space toward Stage 2 will occur. However, this is all speculation, and I do expect an overall GSDM Stage 1 regime to persist until further notice. Only those who do rigorous daily weather-climate monitoring utilizing the GSDM will be the first to catch any kind of a rapid change. It is unlikely any multi-model ensemble prediction scheme will catch an abrupt subseasonal change “until it happens (like ~1 December 2006)”. We also need to remember that predictability with any technique/forecast process is generally quite low during seasonal transitions, which we are about to experience.
There is some model agreement for progressive troughs and ridges across the USA during the next few weeks as seasonal strengthening of the westerlies occur. After this upcoming week’s central/eastern USA trough, I offer a low probability of a stronger event having a Rockies-Plains trough later week 2 into week 3 (~ 7-16 September?). Weather ramifications should be apparent, including the first possible snowfall across the Northern Rockies and an increased likelihood of storminess across the Plains.
In the longer term, should this low AAM regime persist through boreal winter, much of the USA focusing on the western USA into the Plains may have the odds tilted toward a cold and stormy pattern (western trough/southeast states ridge), if there is an Arctic cold air source. Per above, stay tuned.
It is obviously unclear to say where any possible land falling tropical cyclone will go. However, please see the latest statements from the NOAA/NWS/Tropical Prediction Center. At least for week 1, once again relatively stable air is penetrating the deep Tropical North Atlantic Ocean (TNA) basin. Thus tropical cyclone activity for at least the TNA may be suppressed this upcoming week (understanding hybrids and what can occur across the Caribbean).
Locations from the central and eastern equatorial Indian Ocean into China and Southeast Asia are likely to continue with the poundings of intense monsoon rainfall for at least this week into possibly week 2. Perhaps the recent northward shift discussed above may be the last for boreal summer. The likelihood of severe thunderstorms including tropical cyclone activity across the TNWP including the Philippines may increase by week 2. Equatorial North Africa may remain active for at least week 1.
Appendix
An experimental quasi-phase space plot of the GSDM utilizing a time series of normalized relative AAM tendency anomaly (Y-axis) and normalized relative AAM anomaly time series (X-axis) can be found at
http://www.cdc.noaa.gov/map/images/gcm/gsdm_95d.jpg
http://www.cdc.noaa.gov/map/images/gcm/gsdm_40d.jpg
http://www.cdc.noaa.gov/map/clim/gsdm.shtml
We call the behavior of this plot the Global Wind Oscillation (GWO). While the intent of the GSDM is to extend current thinking beyond the MJO, the purpose of the GWO is to illustrate the non-oscillatory component of the GSDM.
These are probabilistic statements, and work is ongoing to quantify in future posts (for example, risk assessment maps and signal to noise ratio plots). We hope that an opportunity will arise for us to have a dedicated web page effort to expedite more objectively, with rigor, thoroughness and verification. The WB (2007) paper on the GSDM has been published in the February issue of MWR. I will try to post an update on about Friday, 31 August.
Ed Berry
Monday, August 20, 2007
When Will The Atmosphere Go "Up"?
Note: The ESRL/PSD AAM plots now present the “complete” budget (updated through 17 August as of this writing), and will be referred to.
Per NOAA/CPC and NOAA/PMEL/TAO buoy data; there is not much overall change to the spatial distribution of global tropical SSTs. The equatorial Indian Ocean and particularly the west central and northwest Pacific Ocean basins (with the horseshoe into the subtropics/midlatitudes) remain above climatology. Anomaly magnitudes are ~1-1.5C with the former and up to 2c for the latter, with totals in excess of 31C along the equator near 140E. The west Pacific Ocean anomalies are deep extending to at least 400m, suggesting an anomalously warm west Pacific Ocean warm pool. Will some of this warmth strongly shift east “sometime during the future?”
Anomalies across the equatorial East Pacific cold tongue remain below normal with recent 5-day averaged values varying from ~.5C just east of the date line to greater than 2C near 110W (~Nino 3). The cool anomalies still extend to around 150-200m deep in the region of 140-160W, with values less than minus 3C at 150m/140W. However, these cool anomalies are relatively localized. It will be interesting to monitor the persistence of these anomalies going into boreal fall since the seasonal cycle favors cooling. The tropical Atlantic Ocean basin remains near average with totals ~27-28C with plus 1-2C anomalies in the areas of the Caribbean and Gulf of Mexico. Overall, again, while the global circulation is strongly La-Nina like (GSDM Stage 1), the SSTs only weakly support that response.
Enhanced tropical convective forcing continues across the Eastern Hemisphere, extending from the central Indian Ocean into portions of the Tropical Northwest Pacific Ocean (TNWP). During the past few days some consolidation of enhanced rainfall has been occurring near 5N/80E, within this larger envelop. Real-time Multivariate MJO Index (RMM) phase space plots from various operational global weather centers suggest a weak MJO signal may be developing in the region of the Indian Ocean. There is also a hint of this possibility from Hovmoller plots designed to isolate coherent modes of tropical variability. Animations of upper tropospheric daily mean vector wind anomalies indicate fairly well defined twin tropical/subtropical anticyclones ~60-90E with downstream twin cyclones west of the date line. Whether or not this evolves into any real coherent MJO dynamical signal or even a northward propagating mode is unclear. Predictions from the RMMs are inconclusive.
Global total and relative atmospheric angular momentum (AAM) are at the lowest magnitudes in at least a year, with the latter near 4 AMUs (at least 3 standard deviations) below the R1 data climatology through 17 August. In fact, the quasi-phase space plot depicting the Global Wind Oscillation (GWO) is “off the scale”. Deep zonal mean easterly wind anomalies dominate much of the tropical atmosphere, with the largest magnitudes across the Southern Hemisphere near 15S (~10 m/s at 200mb). The cause of this extremely low AAM, GSDM Stage 1 regime is unclear. I can speculate this all goes back to dynamical forcing-response feedback processes linked to AAM transports and large GWO circuits that started ~ 1 December 2006, when El-Nino was “stopped in its tracks”. In any event, the SSTs themselves do not support this global circulation. The intense zonal mean easterly wind anomalies have been broadening in latitude during the last couple of weeks. Daily monitoring of if/when these zonal mean easterlies propagate poleward off the equator are critical to determining the most probable future global circulation state.
In recent days both global surface torques has become positive, with the frictional and mountain torques ~10-15 Hadleys. In addition, global relative AAM tendency is near zero and the earth AAM is slightly positive (please see ESRL/PSD R1 data plots for zonal mean details). I think this may be linked to the Eastern Hemisphere tropical convective forcing discussed above. In other words, we should see increasing trades as a response to the Indian Ocean convection. The latter is starting to occur particularly just south of the equator hence driving up the frictional torque. Additionally, I offer speculation that there may also be downward transport of the easterly wind flow anomalies to the earth’s surface coming both from the synoptic eddies (lots of Rossby wave energy dispersion recently going on linking the tropics to the extratropics) and Hadley circulations. However, a diagnostic tool such as the baroclinic CHI problem is needed in real time to quantify this diagnosis.
My bottom line is that at least some zonal mean subtropical/midlatitude westerly flow should be added to the atmosphere during the next 1-3 weeks. However, at best this will only be reflected as a weak oscillation depicted the GWO within an overall steady state GSDM Stage 1 circulation regime. Interestingly, the seasonal transition into boreal fall will impact the outcome of regional-scale circulation anomalies tied to this global weather-climate situation. For example, a reverse phase of the Pacific-North American teleconnection is most probable during GSDM Stage 1 during the cold season. Should this low AAM regime persist through boreal winter, much of the USA focusing on the western USA into the Plains may have the odds tilted toward a cold and stormy pattern (western trough/southeast states ridge), if there is an Arctic cold air source. Careful daily weather-climate monitoring will be needed this fall on just how steady state our Stage 1 regime will be. For example, should there be 2 regions of Eastern Hemisphere tropical convective forcing with the west Pacific Ocean becoming dominate, a “completely different” and sudden evolution may occur.
Most ensemble prediction schemes from operational global weather centers are coming into general agreement for the western USA trough-southeast states ridge pattern weeks 1-2. Improving model agreement makes sense given our general stationary regime having regular Rossby wave energy dispersions linking the tropics and extratropics. However, there is still large uncertainty per issues discussed above.
There is little change from the outlook I issued nearly a week ago. Cooler and wetter is the most probable trend for particularly the Rockies into the Plains of the USA during the next 1-3 weeks. In fact, portions of the northern Rockies may see their first snowfall. The center part of the country may become increasingly stormy with severe thunderstorms and flooding rainfall (which has already occurred in some areas during the last few days). Some of this activity is likely to extend into the Ohio Valley and eastern states. The southeast is likely to continue with above normal heat and humidity. It is obviously unclear to say where any possible land falling tropical cyclone will go. However, the need to monitor this situation is here, and please see the latest statements from the NOAA/NWS/Tropical Prediction Center.
Locations from the central and eastern equatorial Indian Ocean into China and Southeast Asia are likely to continue with the poundings of intense monsoon rainfall for possibly a few more weeks. This region of intense convection may shift northward week 2. The likelihood of thunderstorm activity across the TNWP including the Philippines during weeks 1-3 is unclear. However, frontal activity coming off of East Asia interacting with the warm SSTs could quickly lead to very active weather across those regions. Equatorial North Africa into the Atlantic may have climatologically active thunderstorm activity including tropical cyclone development.
Appendix
An experimental quasi-phase space plot of the GSDM utilizing a time series of normalized relative AAM tendency anomaly (Y-axis) and normalized relative AAM anomaly time series (X-axis) can be found at
http://www.cdc.noaa.gov/map/images/gcm/gsdm_95d.jpg
http://www.cdc.noaa.gov/map/images/gcm/gsdm_40d.jpg
http://www.cdc.noaa.gov/map/clim/gsdm.shtml
We call the behavior of this plot the Global Wind Oscillation (GWO). While the intent of the GSDM is to extend current thinking beyond the MJO, the purpose of the GWO is to illustrate the non-oscillatory component of the GSDM.
These are probabilistic statements, and work is ongoing to quantify in future posts. We hope that an opportunity will arise for us to have a dedicated web page effort to expedite more objectively, with rigor, thoroughness and verification. The WB (2007) paper on the GSDM has been published in the February issue of MWR. My next update will again be early next week due to travel.
Ed Berry
Per NOAA/CPC and NOAA/PMEL/TAO buoy data; there is not much overall change to the spatial distribution of global tropical SSTs. The equatorial Indian Ocean and particularly the west central and northwest Pacific Ocean basins (with the horseshoe into the subtropics/midlatitudes) remain above climatology. Anomaly magnitudes are ~1-1.5C with the former and up to 2c for the latter, with totals in excess of 31C along the equator near 140E. The west Pacific Ocean anomalies are deep extending to at least 400m, suggesting an anomalously warm west Pacific Ocean warm pool. Will some of this warmth strongly shift east “sometime during the future?”
Anomalies across the equatorial East Pacific cold tongue remain below normal with recent 5-day averaged values varying from ~.5C just east of the date line to greater than 2C near 110W (~Nino 3). The cool anomalies still extend to around 150-200m deep in the region of 140-160W, with values less than minus 3C at 150m/140W. However, these cool anomalies are relatively localized. It will be interesting to monitor the persistence of these anomalies going into boreal fall since the seasonal cycle favors cooling. The tropical Atlantic Ocean basin remains near average with totals ~27-28C with plus 1-2C anomalies in the areas of the Caribbean and Gulf of Mexico. Overall, again, while the global circulation is strongly La-Nina like (GSDM Stage 1), the SSTs only weakly support that response.
Enhanced tropical convective forcing continues across the Eastern Hemisphere, extending from the central Indian Ocean into portions of the Tropical Northwest Pacific Ocean (TNWP). During the past few days some consolidation of enhanced rainfall has been occurring near 5N/80E, within this larger envelop. Real-time Multivariate MJO Index (RMM) phase space plots from various operational global weather centers suggest a weak MJO signal may be developing in the region of the Indian Ocean. There is also a hint of this possibility from Hovmoller plots designed to isolate coherent modes of tropical variability. Animations of upper tropospheric daily mean vector wind anomalies indicate fairly well defined twin tropical/subtropical anticyclones ~60-90E with downstream twin cyclones west of the date line. Whether or not this evolves into any real coherent MJO dynamical signal or even a northward propagating mode is unclear. Predictions from the RMMs are inconclusive.
Global total and relative atmospheric angular momentum (AAM) are at the lowest magnitudes in at least a year, with the latter near 4 AMUs (at least 3 standard deviations) below the R1 data climatology through 17 August. In fact, the quasi-phase space plot depicting the Global Wind Oscillation (GWO) is “off the scale”. Deep zonal mean easterly wind anomalies dominate much of the tropical atmosphere, with the largest magnitudes across the Southern Hemisphere near 15S (~10 m/s at 200mb). The cause of this extremely low AAM, GSDM Stage 1 regime is unclear. I can speculate this all goes back to dynamical forcing-response feedback processes linked to AAM transports and large GWO circuits that started ~ 1 December 2006, when El-Nino was “stopped in its tracks”. In any event, the SSTs themselves do not support this global circulation. The intense zonal mean easterly wind anomalies have been broadening in latitude during the last couple of weeks. Daily monitoring of if/when these zonal mean easterlies propagate poleward off the equator are critical to determining the most probable future global circulation state.
In recent days both global surface torques has become positive, with the frictional and mountain torques ~10-15 Hadleys. In addition, global relative AAM tendency is near zero and the earth AAM is slightly positive (please see ESRL/PSD R1 data plots for zonal mean details). I think this may be linked to the Eastern Hemisphere tropical convective forcing discussed above. In other words, we should see increasing trades as a response to the Indian Ocean convection. The latter is starting to occur particularly just south of the equator hence driving up the frictional torque. Additionally, I offer speculation that there may also be downward transport of the easterly wind flow anomalies to the earth’s surface coming both from the synoptic eddies (lots of Rossby wave energy dispersion recently going on linking the tropics to the extratropics) and Hadley circulations. However, a diagnostic tool such as the baroclinic CHI problem is needed in real time to quantify this diagnosis.
My bottom line is that at least some zonal mean subtropical/midlatitude westerly flow should be added to the atmosphere during the next 1-3 weeks. However, at best this will only be reflected as a weak oscillation depicted the GWO within an overall steady state GSDM Stage 1 circulation regime. Interestingly, the seasonal transition into boreal fall will impact the outcome of regional-scale circulation anomalies tied to this global weather-climate situation. For example, a reverse phase of the Pacific-North American teleconnection is most probable during GSDM Stage 1 during the cold season. Should this low AAM regime persist through boreal winter, much of the USA focusing on the western USA into the Plains may have the odds tilted toward a cold and stormy pattern (western trough/southeast states ridge), if there is an Arctic cold air source. Careful daily weather-climate monitoring will be needed this fall on just how steady state our Stage 1 regime will be. For example, should there be 2 regions of Eastern Hemisphere tropical convective forcing with the west Pacific Ocean becoming dominate, a “completely different” and sudden evolution may occur.
Most ensemble prediction schemes from operational global weather centers are coming into general agreement for the western USA trough-southeast states ridge pattern weeks 1-2. Improving model agreement makes sense given our general stationary regime having regular Rossby wave energy dispersions linking the tropics and extratropics. However, there is still large uncertainty per issues discussed above.
There is little change from the outlook I issued nearly a week ago. Cooler and wetter is the most probable trend for particularly the Rockies into the Plains of the USA during the next 1-3 weeks. In fact, portions of the northern Rockies may see their first snowfall. The center part of the country may become increasingly stormy with severe thunderstorms and flooding rainfall (which has already occurred in some areas during the last few days). Some of this activity is likely to extend into the Ohio Valley and eastern states. The southeast is likely to continue with above normal heat and humidity. It is obviously unclear to say where any possible land falling tropical cyclone will go. However, the need to monitor this situation is here, and please see the latest statements from the NOAA/NWS/Tropical Prediction Center.
Locations from the central and eastern equatorial Indian Ocean into China and Southeast Asia are likely to continue with the poundings of intense monsoon rainfall for possibly a few more weeks. This region of intense convection may shift northward week 2. The likelihood of thunderstorm activity across the TNWP including the Philippines during weeks 1-3 is unclear. However, frontal activity coming off of East Asia interacting with the warm SSTs could quickly lead to very active weather across those regions. Equatorial North Africa into the Atlantic may have climatologically active thunderstorm activity including tropical cyclone development.
Appendix
An experimental quasi-phase space plot of the GSDM utilizing a time series of normalized relative AAM tendency anomaly (Y-axis) and normalized relative AAM anomaly time series (X-axis) can be found at
http://www.cdc.noaa.gov/map/images/gcm/gsdm_95d.jpg
http://www.cdc.noaa.gov/map/images/gcm/gsdm_40d.jpg
http://www.cdc.noaa.gov/map/clim/gsdm.shtml
We call the behavior of this plot the Global Wind Oscillation (GWO). While the intent of the GSDM is to extend current thinking beyond the MJO, the purpose of the GWO is to illustrate the non-oscillatory component of the GSDM.
These are probabilistic statements, and work is ongoing to quantify in future posts. We hope that an opportunity will arise for us to have a dedicated web page effort to expedite more objectively, with rigor, thoroughness and verification. The WB (2007) paper on the GSDM has been published in the February issue of MWR. My next update will again be early next week due to travel.
Ed Berry
Tuesday, August 14, 2007
End of Days
Note: The R1 data ESRL/PSD AAM plots now present the “complete” budget (updated through 11 August as of this writing), and will be referred to.
This posting will be relatively short. The spatial distribution of global tropical and subtropical SSTs is similar to what was discussed on 9 August. There has been cooling across the equatorial East Pacific cold tongue loosely in the Nino 3 region. Recent 5-day averaged anomalies (per TAO buoy data) are ~minus 2.5C at the surface extending to depths ~150m at 140-160W with values ~minus 4C. While the global circulation is strongly La-Nina like, perhaps the equatorial East Pacific may be starting to respond.
The strongest tropical convective forcing remains well entrenched across the Eastern Hemisphere. One anomalous region has been festering across the equatorial Indian Ocean centered ~5S/90E with another focused across the Tropical Northwest Pacific Ocean (TNWP) just east of the Philippines. The South Asian monsoon system has also intensified during the last week. There is also minor enhancement of tropical rainfall around the Americas, and easterly wave activity across northern equatorial Africa has become quite intense.
Some evidence indicates another ~40-day mode of tropical rainfall variability maybe organizing across the equatorial Indian Ocean. However, recent full disk satellite imagery already suggests a quickening of eastward movement of the thunderstorm clusters. We will see if this possible episode organizes into a MJO particularly if it propagates northeast. In any case, we are still stuck in a generally stationary GSDM Stage 1 (more said below) base state having generally weak subseasonal variations. A difference is that our nemesis of 2 regions of Eastern Hemisphere tropical convective forcing may be starting to appear as seasonal transition to the boreal cold season approaches.
Total and relative angular momentum is probably the lowest in at least a year. Both are ~minus 2.5-3 AMUs below the R1 data climatology, and much of the contribution is coming from deep zonal mean easterly wind flow anomalies throughout the tropical and subtropical atmospheres. The largest zonal mean magnitudes are in the Southern Hemisphere (SH), having 200mb easterly wind anomalies ~10m/s. There is also a strong poleward transport signal from the SH tropics into the lower midlatitudes, with a weaker counterpart developing north of the equator. Global relative AAM tendency is ~minus 25 Hadleys as of 11 August and the Global Wind Oscillation (GWO) is as far to left as I have seen it, in the GSDM Stage 4-1 quasi-phase space. The global signal from the surface torques is still weak (for now).
There are currently strong twin upper tropospheric anticyclones with extensive cross-equatorial flow centered ~80E tied to the Indian Ocean (IO) tropical forcing. A weak compensating set of cyclones is present just west of the date line. With the exception of this date line cyclone pair, the entire tropics is dominated by upper tropospheric easterly wind flow, with anomalies ~15-25m/s from Africa into the Atlantic Ocean (favorable for convectively active easterly waves). Rossby wave energy dispersions (RWDs) across the Northern Hemisphere (NH) extratropics interacting with both the IO and TNWP forcing are already impacting North America. Combined with what I expect to be strengthening zonal mean westerly flow across the NH midlatitudes, my notion offered 9 August of the trough-ridge-trough pattern across the USA shifting southeast looks probable. In fact, the western USA may see a return to a barrage of troughs similar to last spring going into September, possibly interacting with a cold air source from Canada.
Week-2 ensemble means from several international operational weather centers are offering varying solutions for North America; however, there has been a recent trend toward a western USA trough with a southeast states ridge. As before, when I see the numerical models trend toward what diagnostic reasoning suggests (per GSDM), my confidence increases. The latter should be the case since I am utilizing a proposed more complete forecast process for subseasonal prediction. Nevertheless, uncertainty is still huge given issues such as the future evolution of the tropical forcing and seasonal transition. The general synoptic pattern across the PNA sector this fall will have some dependency on the GWO. For example, will there be a return to large circuits to GSDM Stage 2, etc. (especially if the warm TNWP stays active)?
Cooler and wetter weather is the most probable trend for particularly the northwest half of the USA during the next 1-3 weeks. The southeast is likely to continue with above normal heat and humidity. It is obviously unclear to say where any possible land falling tropical cyclone will go. However, the need to monitor this situation is likely to increase (see latest statements from the NOAA/NWS/Tropical Prediction Center). The center part of the country is also likely to become increasingly stormy, including severe thunderstorms and flooding rainfall.
Locations from India into China and Southeast Asia are likely to continue with the poundings of intense monsoon rainfall possibly for several more weeks. The TNWP including the Philippines are also probable to stay active with heavy rain and tropical cyclone activity week 1, with perhaps a respite across the west central Pacific for at least week 2. Northern equatorial Africa is likely to stay active through at least week 1, and I think the Atlantic Hurricane Season “is about to get underway”.
Appendix
An experimental quasi-phase space plot of the GSDM utilizing a time series of normalized relative AAM tendency anomaly (Y-axis) and normalized relative AAM anomaly time series (X-axis) can be found at
http://www.cdc.noaa.gov/map/images/gcm/gsdm_95d.jpg
http://www.cdc.noaa.gov/map/images/gcm/gsdm_40d.jpg
http://www.cdc.noaa.gov/map/clim/gsdm.shtml
We call the behavior of this plot the Global Wind Oscillation (GWO). While the intent of the GSDM is to extend current thinking beyond the MJO, the purpose of the GWO is to illustrate the non-oscillatory component of the GSDM.
These are probabilistic statements, and work is ongoing to quantify in future posts. We hope that an opportunity will arise for us to have a dedicated web page effort to expedite more objectively, with rigor, thoroughness and verification. The WB (2007) paper on the GSDM has been published in the February issue of MWR. My next update should be early next week. In general, due to covering shifts and travel, my postings will be irregular through at least the rest of this month.
Ed Berry
This posting will be relatively short. The spatial distribution of global tropical and subtropical SSTs is similar to what was discussed on 9 August. There has been cooling across the equatorial East Pacific cold tongue loosely in the Nino 3 region. Recent 5-day averaged anomalies (per TAO buoy data) are ~minus 2.5C at the surface extending to depths ~150m at 140-160W with values ~minus 4C. While the global circulation is strongly La-Nina like, perhaps the equatorial East Pacific may be starting to respond.
The strongest tropical convective forcing remains well entrenched across the Eastern Hemisphere. One anomalous region has been festering across the equatorial Indian Ocean centered ~5S/90E with another focused across the Tropical Northwest Pacific Ocean (TNWP) just east of the Philippines. The South Asian monsoon system has also intensified during the last week. There is also minor enhancement of tropical rainfall around the Americas, and easterly wave activity across northern equatorial Africa has become quite intense.
Some evidence indicates another ~40-day mode of tropical rainfall variability maybe organizing across the equatorial Indian Ocean. However, recent full disk satellite imagery already suggests a quickening of eastward movement of the thunderstorm clusters. We will see if this possible episode organizes into a MJO particularly if it propagates northeast. In any case, we are still stuck in a generally stationary GSDM Stage 1 (more said below) base state having generally weak subseasonal variations. A difference is that our nemesis of 2 regions of Eastern Hemisphere tropical convective forcing may be starting to appear as seasonal transition to the boreal cold season approaches.
Total and relative angular momentum is probably the lowest in at least a year. Both are ~minus 2.5-3 AMUs below the R1 data climatology, and much of the contribution is coming from deep zonal mean easterly wind flow anomalies throughout the tropical and subtropical atmospheres. The largest zonal mean magnitudes are in the Southern Hemisphere (SH), having 200mb easterly wind anomalies ~10m/s. There is also a strong poleward transport signal from the SH tropics into the lower midlatitudes, with a weaker counterpart developing north of the equator. Global relative AAM tendency is ~minus 25 Hadleys as of 11 August and the Global Wind Oscillation (GWO) is as far to left as I have seen it, in the GSDM Stage 4-1 quasi-phase space. The global signal from the surface torques is still weak (for now).
There are currently strong twin upper tropospheric anticyclones with extensive cross-equatorial flow centered ~80E tied to the Indian Ocean (IO) tropical forcing. A weak compensating set of cyclones is present just west of the date line. With the exception of this date line cyclone pair, the entire tropics is dominated by upper tropospheric easterly wind flow, with anomalies ~15-25m/s from Africa into the Atlantic Ocean (favorable for convectively active easterly waves). Rossby wave energy dispersions (RWDs) across the Northern Hemisphere (NH) extratropics interacting with both the IO and TNWP forcing are already impacting North America. Combined with what I expect to be strengthening zonal mean westerly flow across the NH midlatitudes, my notion offered 9 August of the trough-ridge-trough pattern across the USA shifting southeast looks probable. In fact, the western USA may see a return to a barrage of troughs similar to last spring going into September, possibly interacting with a cold air source from Canada.
Week-2 ensemble means from several international operational weather centers are offering varying solutions for North America; however, there has been a recent trend toward a western USA trough with a southeast states ridge. As before, when I see the numerical models trend toward what diagnostic reasoning suggests (per GSDM), my confidence increases. The latter should be the case since I am utilizing a proposed more complete forecast process for subseasonal prediction. Nevertheless, uncertainty is still huge given issues such as the future evolution of the tropical forcing and seasonal transition. The general synoptic pattern across the PNA sector this fall will have some dependency on the GWO. For example, will there be a return to large circuits to GSDM Stage 2, etc. (especially if the warm TNWP stays active)?
Cooler and wetter weather is the most probable trend for particularly the northwest half of the USA during the next 1-3 weeks. The southeast is likely to continue with above normal heat and humidity. It is obviously unclear to say where any possible land falling tropical cyclone will go. However, the need to monitor this situation is likely to increase (see latest statements from the NOAA/NWS/Tropical Prediction Center). The center part of the country is also likely to become increasingly stormy, including severe thunderstorms and flooding rainfall.
Locations from India into China and Southeast Asia are likely to continue with the poundings of intense monsoon rainfall possibly for several more weeks. The TNWP including the Philippines are also probable to stay active with heavy rain and tropical cyclone activity week 1, with perhaps a respite across the west central Pacific for at least week 2. Northern equatorial Africa is likely to stay active through at least week 1, and I think the Atlantic Hurricane Season “is about to get underway”.
Appendix
An experimental quasi-phase space plot of the GSDM utilizing a time series of normalized relative AAM tendency anomaly (Y-axis) and normalized relative AAM anomaly time series (X-axis) can be found at
http://www.cdc.noaa.gov/map/images/gcm/gsdm_95d.jpg
http://www.cdc.noaa.gov/map/images/gcm/gsdm_40d.jpg
http://www.cdc.noaa.gov/map/clim/gsdm.shtml
We call the behavior of this plot the Global Wind Oscillation (GWO). While the intent of the GSDM is to extend current thinking beyond the MJO, the purpose of the GWO is to illustrate the non-oscillatory component of the GSDM.
These are probabilistic statements, and work is ongoing to quantify in future posts. We hope that an opportunity will arise for us to have a dedicated web page effort to expedite more objectively, with rigor, thoroughness and verification. The WB (2007) paper on the GSDM has been published in the February issue of MWR. My next update should be early next week. In general, due to covering shifts and travel, my postings will be irregular through at least the rest of this month.
Ed Berry
Thursday, August 09, 2007
Still Slaying -- Update
Note: The ESRL/PSD AAM plots now present the “complete” budget (updated through 6 August as of this writing), and will be referred to.
Per CPC and other data sets, global tropical SSTs are generally above average across the Eastern Hemisphere while cooler than normal across the equatorial central and east Pacific and about climatology across the Atlantic Ocean. Anomaly magnitudes vary from ~0.5-2C with the greatest across portions of the equatorial Indian Ocean and west of South America ~110-120W (even ~minus 3 on 8 August). The latter is in the Nino 3 region, and recent enhanced trades have contributed to some cooling during the last week. In fact, subsurface anomalies are as low as roughly minus 3C at 160W/150m per latest 5-day averaged TAO buoy data suggestive of the thermocline being raised. Warmest SST totals remain across the west central-northwest Pacific Ocean and the Caribbean-Gulf of Mexico regions with values ~29-30C. While the global circulation is very much La-Nina like, the SST pattern is only weakly representative of a cold event.
Weather-climate linkage signals continue to be extremely difficult to interpret. The MJO has virtually collapsed. All Wheeler-Hendon type phase space plots from international weather centers have projections less than 1 standard deviation. There is some “tilt” back toward the Indian Ocean, and attention needs to be paid to that for predicting upcoming subseasonal evolution.
As part of a consolidation with an equatorial Rossby mode, about a week ago a northeastward propagating component weakly projecting onto a MJO came out into the Tropical Northwest Pacific Ocean (TNWP). Per coherent modes Hovmollers the signal made it as far east as ~160E. A couple of tropical cyclones have developed in that region since. At this time the most significant tropical forcing remains well back in the Eastern Hemisphere centered at about 15N/120E. There is loose evidence of a tropical convective component moving into the Western Hemisphere. Recent 3-day averaged OLRA present ~minus 70 W/m**2 and lower around the Philippines. There are also negative anomalies north of the equator at the date line (a response to the weak signal moving into the Western Hemisphere) and back across the equatorial Indian Ocean. Notable positive anomalies of OLR are centered on the region of Indonesia.
Full disk satellite imagery nicely shows the convection around the Philippines while extending west and southwest into the Bay of Bengal. This is a change in the orientation discussed late week. Equatorial Africa into the equatorial Indian Ocean is getting more active. I have speculation that in the wake of our recent northward propagating event from the equator into the Southeast Asia, another one may be getting organized. It is possible this may be a form of 20-30 day variability, linked to the extratropics, and within what has been a stationary GSDM Stage 1 base state given boreal summer (discussed below).
Typical of a cold event, global total and relative atmospheric angular momentum (AAM) continues very low, roughly minus 2 Atmospheric Momentum Units (AMUs). The mass term has increased somewhat during the last week. The last MJO event did not add as much zonal mean westerly wind flow to the atmosphere as I previously thought. In fact, the Global Wind Oscillation (GWO) updated through 5 August (5-day average) objectively shows the global circulation solidly in GSDM Stage 1. There was only a pathetic circuit when the MJO came out.
Zonal mean easterly wind flow anomalies have been rapidly increasing throughout the equatorial and subtropical atmospheres over the last few days. At 200mb magnitudes are ~5m/s, flanked by zonal mean westerly wind flow anomalies at the mid and higher latitudes. A meridional distribution of zonal mean zonal wind anomalies such as these supports anomalously strong subtropical ridges from the Devil including the one impacting the USA. Hence global relative AAM tendency is negative (~15 Hadleys) and the surface torques is also trending toward less than zero. Finally, the coriolis torque is also ~minus 10-20 Hadleys when loosely it should be positive at this time.
Animations of upper tropospheric daily mean vector wind anomaly fields suggest twin tropical/subtropical anticyclones redeveloping across the Indian Ocean while the pair across the west central Pacific weakens. There are weak twin cyclones along and just east of the date line. The upper tropospheric Western Hemisphere Pacific Ocean equatorial westerly wind flow anomalies also discussed last week have weakened significantly and are going into the Southern Hemisphere. It was Rossby wave energy dispersions (RWDs) arcing across Asia interacting with the west Pacific anticyclones that contributed to eastward shift of what was the “wicked ridge of the west” (western USA for international readers).I can already see the RWDs coming out of the Indian Ocean that will lead to some retrogression of the Deep South ridge back toward the Plains. This will not be as far west as some numerical ensemble solutions were indicating a week-10 days ago.
Uncertainty remains huge for making any subseasonal forecast, particularly as we start to head into fall. During the last couple of weeks I think have had somewhat better success with what I have believed to be the most probable options. I am going to be bold here and speculate that the MJO dynamical signal, having interactions with the extratropics (forcing-response-feedbacks, etc.), is going to get its act back together across the Indian Ocean during the next week or so and then propagate east-northeast into the TNWP by roughly weeks 3-4. How intense this event may be and its impact on the GWO is unclear. I would like to see the Wheeler-Hendon plots come out of their “1 sigma” circles “soon” across the region of the Indian Ocean. Should this occur, any model, numerical, statistical, etc. is unlikely to predict this possibility right now. It would be interesting to see what “brute force stochastics” might give us right now about MJO and anything else dealing with making predictions in our current lazy GSDM Stage 1 regime. For weeks 1-4, let’s stick with Stage 1 through week 2 possibly getting perturbed a bit to Stage 2 during weeks 3-4.
I think the ramifications for the USA are obvious by now. For much of week 1 deadly intense heat is a good bet centered from the Plains into the Deep South. Severe MCS activity will occur on the northern fringes of this ridge from Hell, likely from the Northern Rockies to the Great Lakes into portions of the eastern USA. This general trough-ridge-trough pattern across the USA should shift southeast weeks 2-4 if the scenario discussed above is realized.
Some respite for portions of India and Bangladesh from the severe storms and flooding may occur during a portion of week 1. However, locations from India into China and Southeast Asia are likely to continue with the poundings of intense monsoon rainfall possibly for several more weeks. As I type a tropical cyclone is trying to develop across the far northern Arabian Sea, which should weaken as it gets inland (but not before causing “problems”). While northern equatorial Africa is getting active, dry stable air from the North Atlantic Ocean has been inhibiting tropical cyclone development of the waves as they move off the West African coast. While I can offer some attribution to this, suffice to say this situation needs to change if there is to be an active Atlantic tropical cyclone season (understanding the Caribbean, etc.). Finally, more strong troughs appear on the horizon for Europe for at least the next couple of weeks.
Stay tuned if we start to observe 2 regions of Eastern Hemisphere tropical convective forcing this fall, the Indian and west central Pacific Oceans. If the former dominates, GSDM Stage 4-1 would be most probable.
Appendix
An experimental quasi-phase space plot of the GSDM utilizing a time series of normalized relative AAM tendency anomaly (Y-axis) and normalized relative AAM anomaly time series (X-axis) can be found at
http://www.cdc.noaa.gov/map/images/gcm/gsdm_95d.jpg
http://www.cdc.noaa.gov/map/images/gcm/gsdm_40d.jpg
http://www.cdc.noaa.gov/map/clim/gsdm.shtml (general link)
We call the behavior of this plot the Global Wind Oscillation (GWO), and one of its purposes is to extend thinking beyond the MJO.
These are probabilistic statements, and work is ongoing to quantify in future posts. We hope that an opportunity will arise for us to have a dedicated web page effort to expedite more objectively, with rigor, thoroughness and verification. The WB (2007) paper on the GSDM has been published in the February issue of MWR. I will try to do an update early next week. In general, due to covering shifts and travel, my postings will be irregular through at least the rest of this month.
Ed Berry
Per CPC and other data sets, global tropical SSTs are generally above average across the Eastern Hemisphere while cooler than normal across the equatorial central and east Pacific and about climatology across the Atlantic Ocean. Anomaly magnitudes vary from ~0.5-2C with the greatest across portions of the equatorial Indian Ocean and west of South America ~110-120W (even ~minus 3 on 8 August). The latter is in the Nino 3 region, and recent enhanced trades have contributed to some cooling during the last week. In fact, subsurface anomalies are as low as roughly minus 3C at 160W/150m per latest 5-day averaged TAO buoy data suggestive of the thermocline being raised. Warmest SST totals remain across the west central-northwest Pacific Ocean and the Caribbean-Gulf of Mexico regions with values ~29-30C. While the global circulation is very much La-Nina like, the SST pattern is only weakly representative of a cold event.
Weather-climate linkage signals continue to be extremely difficult to interpret. The MJO has virtually collapsed. All Wheeler-Hendon type phase space plots from international weather centers have projections less than 1 standard deviation. There is some “tilt” back toward the Indian Ocean, and attention needs to be paid to that for predicting upcoming subseasonal evolution.
As part of a consolidation with an equatorial Rossby mode, about a week ago a northeastward propagating component weakly projecting onto a MJO came out into the Tropical Northwest Pacific Ocean (TNWP). Per coherent modes Hovmollers the signal made it as far east as ~160E. A couple of tropical cyclones have developed in that region since. At this time the most significant tropical forcing remains well back in the Eastern Hemisphere centered at about 15N/120E. There is loose evidence of a tropical convective component moving into the Western Hemisphere. Recent 3-day averaged OLRA present ~minus 70 W/m**2 and lower around the Philippines. There are also negative anomalies north of the equator at the date line (a response to the weak signal moving into the Western Hemisphere) and back across the equatorial Indian Ocean. Notable positive anomalies of OLR are centered on the region of Indonesia.
Full disk satellite imagery nicely shows the convection around the Philippines while extending west and southwest into the Bay of Bengal. This is a change in the orientation discussed late week. Equatorial Africa into the equatorial Indian Ocean is getting more active. I have speculation that in the wake of our recent northward propagating event from the equator into the Southeast Asia, another one may be getting organized. It is possible this may be a form of 20-30 day variability, linked to the extratropics, and within what has been a stationary GSDM Stage 1 base state given boreal summer (discussed below).
Typical of a cold event, global total and relative atmospheric angular momentum (AAM) continues very low, roughly minus 2 Atmospheric Momentum Units (AMUs). The mass term has increased somewhat during the last week. The last MJO event did not add as much zonal mean westerly wind flow to the atmosphere as I previously thought. In fact, the Global Wind Oscillation (GWO) updated through 5 August (5-day average) objectively shows the global circulation solidly in GSDM Stage 1. There was only a pathetic circuit when the MJO came out.
Zonal mean easterly wind flow anomalies have been rapidly increasing throughout the equatorial and subtropical atmospheres over the last few days. At 200mb magnitudes are ~5m/s, flanked by zonal mean westerly wind flow anomalies at the mid and higher latitudes. A meridional distribution of zonal mean zonal wind anomalies such as these supports anomalously strong subtropical ridges from the Devil including the one impacting the USA. Hence global relative AAM tendency is negative (~15 Hadleys) and the surface torques is also trending toward less than zero. Finally, the coriolis torque is also ~minus 10-20 Hadleys when loosely it should be positive at this time.
Animations of upper tropospheric daily mean vector wind anomaly fields suggest twin tropical/subtropical anticyclones redeveloping across the Indian Ocean while the pair across the west central Pacific weakens. There are weak twin cyclones along and just east of the date line. The upper tropospheric Western Hemisphere Pacific Ocean equatorial westerly wind flow anomalies also discussed last week have weakened significantly and are going into the Southern Hemisphere. It was Rossby wave energy dispersions (RWDs) arcing across Asia interacting with the west Pacific anticyclones that contributed to eastward shift of what was the “wicked ridge of the west” (western USA for international readers).I can already see the RWDs coming out of the Indian Ocean that will lead to some retrogression of the Deep South ridge back toward the Plains. This will not be as far west as some numerical ensemble solutions were indicating a week-10 days ago.
Uncertainty remains huge for making any subseasonal forecast, particularly as we start to head into fall. During the last couple of weeks I think have had somewhat better success with what I have believed to be the most probable options. I am going to be bold here and speculate that the MJO dynamical signal, having interactions with the extratropics (forcing-response-feedbacks, etc.), is going to get its act back together across the Indian Ocean during the next week or so and then propagate east-northeast into the TNWP by roughly weeks 3-4. How intense this event may be and its impact on the GWO is unclear. I would like to see the Wheeler-Hendon plots come out of their “1 sigma” circles “soon” across the region of the Indian Ocean. Should this occur, any model, numerical, statistical, etc. is unlikely to predict this possibility right now. It would be interesting to see what “brute force stochastics” might give us right now about MJO and anything else dealing with making predictions in our current lazy GSDM Stage 1 regime. For weeks 1-4, let’s stick with Stage 1 through week 2 possibly getting perturbed a bit to Stage 2 during weeks 3-4.
I think the ramifications for the USA are obvious by now. For much of week 1 deadly intense heat is a good bet centered from the Plains into the Deep South. Severe MCS activity will occur on the northern fringes of this ridge from Hell, likely from the Northern Rockies to the Great Lakes into portions of the eastern USA. This general trough-ridge-trough pattern across the USA should shift southeast weeks 2-4 if the scenario discussed above is realized.
Some respite for portions of India and Bangladesh from the severe storms and flooding may occur during a portion of week 1. However, locations from India into China and Southeast Asia are likely to continue with the poundings of intense monsoon rainfall possibly for several more weeks. As I type a tropical cyclone is trying to develop across the far northern Arabian Sea, which should weaken as it gets inland (but not before causing “problems”). While northern equatorial Africa is getting active, dry stable air from the North Atlantic Ocean has been inhibiting tropical cyclone development of the waves as they move off the West African coast. While I can offer some attribution to this, suffice to say this situation needs to change if there is to be an active Atlantic tropical cyclone season (understanding the Caribbean, etc.). Finally, more strong troughs appear on the horizon for Europe for at least the next couple of weeks.
Stay tuned if we start to observe 2 regions of Eastern Hemisphere tropical convective forcing this fall, the Indian and west central Pacific Oceans. If the former dominates, GSDM Stage 4-1 would be most probable.
Appendix
An experimental quasi-phase space plot of the GSDM utilizing a time series of normalized relative AAM tendency anomaly (Y-axis) and normalized relative AAM anomaly time series (X-axis) can be found at
http://www.cdc.noaa.gov/map/images/gcm/gsdm_95d.jpg
http://www.cdc.noaa.gov/map/images/gcm/gsdm_40d.jpg
http://www.cdc.noaa.gov/map/clim/gsdm.shtml (general link)
We call the behavior of this plot the Global Wind Oscillation (GWO), and one of its purposes is to extend thinking beyond the MJO.
These are probabilistic statements, and work is ongoing to quantify in future posts. We hope that an opportunity will arise for us to have a dedicated web page effort to expedite more objectively, with rigor, thoroughness and verification. The WB (2007) paper on the GSDM has been published in the February issue of MWR. I will try to do an update early next week. In general, due to covering shifts and travel, my postings will be irregular through at least the rest of this month.
Ed Berry
Friday, August 03, 2007
Update from the Slayer
The spatial distribution of global tropical/subtropical SSTs is similar to what was discussed on 31 July. There remains warmth across the Indian and west central Pacific Oceans with cool anomalies across portions of equatorial Indonesia. Impressive warmth remains around the South China Sea and northwest Pacific Ocean with SST totals in excess of 30C. The equatorial East Pacific cool anomalies are ~minus 1-2C while the subsurface continues to moderate.
Tropical convective forcing has become better organized centered ~10-15N/120E while extending in a band from India east-southeast into the west central and northwest Pacific Ocean. Three-day averaged OLRA are roughly minus 50-90W/m**2 with this enhanced rainfall, and there has been a slow east-northeastward shift of this activity toward the Tropical Northwest Pacific Ocean (TNWP). Other somewhat enhanced rainfall continues along the East Pacific ITCZ and Africa north of the equator.
Animations of upper tropospheric daily mean vector wind anomalies do give a nice signal of slow eastward movement across the tropics/subtropics. Since 31 July robust twin anticyclones have appeared ~140E having 150mb anomalies around 15-30 m/s while weaker anticyclones persist across Africa. There are downstream anomalous troughs just west of the date line with equatorial westerlies (15-25 m/s anomalies) across the Western Hemisphere to about South America. Rossby wave energy dispersions from both hemispheres are interacting with these features. Included is a Northern Hemispheric component across the Pacific Ocean to the first in a series of troughs about to dig along the west coast of the USA.
This circulation response working with other dynamical processes such as global frictional and mountain torques is adding westerly flow to the atmosphere. In fact, calculated relative AAM tendency (per R1 data) through 28 July which includes budget terms such as Coriolis torque and transports was ~plus 20 Hadleys. However, total AAM remains very low, roughly 3 AMUs (Atmospheric Momentum Units) below normal, and the Global Wind Oscillation (GWO) updated through 29 July is well to the left. The global circulation continues to behave La-Nina like, solidly in GSDM Stage 1. As the Eastern Hemisphere tropical forcing continues into the TNWP, interactions with the extratropics do include the possibility of a mountain-frictional torque index cycle. The latter would increase zonal mean westerly flow across the subtropical atmospheres of both hemispheres (ideally).
I remain unchanged in my feeling that this GSDM Stage 1 base state should be perturbed enough for the GWO to orbit to GSDM Stage 2. The magnitude and amount of persistence of this perturbation are unclear, particularly considering seasonal cycle issues. Overall, we may see GSDM Stage 1-2 for the next few weeks, then collapse to Stage 4-1 per reasons discussed last posting. Uncertainty remains huge about this specific subseasonal issue. However, at least synoptically for the USA the major circulation pattern reversal with an anomalous western USA trough and Deep South ridge is probable. Furthermore, Rossby wave energy dispersions arcing from the Indian Ocean tropical forcing into the higher latitudes will contribute to an anomalous deep cyclone covering much of western and central Canada. Hence a full latitude trough extending into the western USA is a good forecast meaning the polar westerlies should shift southward. Most numerical ensemble prediction schemes have now captured this change.
There has been some thought from at least one official forecast center based on model output the ridge may return to the Rockies during week 2. While this is an option, I could easily argue a “cold/wet regime” from the east slopes of the Rockies into the Plains weeks 2-3 should the TNWP become extremely active with several typhoons. Again, this emphasizes the uncertainty given the stochastic nature of the atmosphere. Right now there is little if any support from ensembles for a central USA cold/wet pattern weeks 2-3 (for example, like August 2004 as discussed in one of our weather-climate discussions on the ESRL/PSD MJO web site). Should this less probable scenario happen, it is currently outside the envelope range of uncertainty sampled any of the operational global models (multi-model ensemble spread). Again, this emphasizes the need for a weather-climate linkage diagnostic component (the GSDM) including daily monitoring to correctly making subseasonal predictions as part of a complete forecast process. Multi-model ensembles alone are not enough, particularly considering their biases, data assimilation issues, not predicting tropical convection correctly after about day 5, etc…………..
There is little change in my outlooks for weeks 1-3 (through ~24 August). The “wicked ridge of the west” will expand into the Deep South and eastern USA as the westerlies come southward into the Rockies and Plains downstream from the western USA trough. A reversal of the temperature and precipitation anomalies observed across much of the country for the last 4-6 weeks may occur. Severe MCS activity with flooding rainfall is likely from the Northern Plains into the Ohio Valley periodically through at least the middle of this month. This “storm track” should slowly shift south. Intense heat may focus on the south central into the mid-Atlantic states, along with high dewpoints.
Internationally, severe thunderstorms and heavy rainfall are probable from southern China into the Philippines at least weeks 1-2. Additional typhoon activity is probable for the TNWP weeks 1-3, possibly impacting locations such as China and Japan. Finally, tropical waves moving west from Africa have been recently intensifying. However, for numerous reasons I am now unclear about the risk of tropical cyclone development across the North Atlantic Ocean at least through week 2. The latter is yet another example why there is not a linear relationship between La-Nina basic states and an increased risk of North Atlantic tropical cyclone activity, at least subseasonally.
Appendix
An experimental quasi-phase space plot of the GSDM utilizing a time series of normalized relative AAM tendency anomaly (Y-axis) and normalized relative AAM anomaly time series (X-axis) can be found at
http://www.cdc.noaa.gov/map/images/gcm/gsdm_95d.jpg
http://www.cdc.noaa.gov/map/images/gcm/gsdm_40d.jpg
We call the behavior exhibited by this plot the Global Wind Oscillation (GWO), and one of its purposes is to extend thinking beyond the MJO.These are probabilistic statements, and work is ongoing to quantify in future posts. We hope that an opportunity will arise for us to have a dedicated web page effort to expedite more objectively, with rigor, thoroughness and verification. The WB (2007) paper on the GSDM has been published in the February issue of MWR.
My next posting will not be until late next week since I have to cover a set of overnight shifts. In general, due to covering shifts and travel, my discussions will be irregular through at least the end of this month.
Ed Berry
Tropical convective forcing has become better organized centered ~10-15N/120E while extending in a band from India east-southeast into the west central and northwest Pacific Ocean. Three-day averaged OLRA are roughly minus 50-90W/m**2 with this enhanced rainfall, and there has been a slow east-northeastward shift of this activity toward the Tropical Northwest Pacific Ocean (TNWP). Other somewhat enhanced rainfall continues along the East Pacific ITCZ and Africa north of the equator.
Animations of upper tropospheric daily mean vector wind anomalies do give a nice signal of slow eastward movement across the tropics/subtropics. Since 31 July robust twin anticyclones have appeared ~140E having 150mb anomalies around 15-30 m/s while weaker anticyclones persist across Africa. There are downstream anomalous troughs just west of the date line with equatorial westerlies (15-25 m/s anomalies) across the Western Hemisphere to about South America. Rossby wave energy dispersions from both hemispheres are interacting with these features. Included is a Northern Hemispheric component across the Pacific Ocean to the first in a series of troughs about to dig along the west coast of the USA.
This circulation response working with other dynamical processes such as global frictional and mountain torques is adding westerly flow to the atmosphere. In fact, calculated relative AAM tendency (per R1 data) through 28 July which includes budget terms such as Coriolis torque and transports was ~plus 20 Hadleys. However, total AAM remains very low, roughly 3 AMUs (Atmospheric Momentum Units) below normal, and the Global Wind Oscillation (GWO) updated through 29 July is well to the left. The global circulation continues to behave La-Nina like, solidly in GSDM Stage 1. As the Eastern Hemisphere tropical forcing continues into the TNWP, interactions with the extratropics do include the possibility of a mountain-frictional torque index cycle. The latter would increase zonal mean westerly flow across the subtropical atmospheres of both hemispheres (ideally).
I remain unchanged in my feeling that this GSDM Stage 1 base state should be perturbed enough for the GWO to orbit to GSDM Stage 2. The magnitude and amount of persistence of this perturbation are unclear, particularly considering seasonal cycle issues. Overall, we may see GSDM Stage 1-2 for the next few weeks, then collapse to Stage 4-1 per reasons discussed last posting. Uncertainty remains huge about this specific subseasonal issue. However, at least synoptically for the USA the major circulation pattern reversal with an anomalous western USA trough and Deep South ridge is probable. Furthermore, Rossby wave energy dispersions arcing from the Indian Ocean tropical forcing into the higher latitudes will contribute to an anomalous deep cyclone covering much of western and central Canada. Hence a full latitude trough extending into the western USA is a good forecast meaning the polar westerlies should shift southward. Most numerical ensemble prediction schemes have now captured this change.
There has been some thought from at least one official forecast center based on model output the ridge may return to the Rockies during week 2. While this is an option, I could easily argue a “cold/wet regime” from the east slopes of the Rockies into the Plains weeks 2-3 should the TNWP become extremely active with several typhoons. Again, this emphasizes the uncertainty given the stochastic nature of the atmosphere. Right now there is little if any support from ensembles for a central USA cold/wet pattern weeks 2-3 (for example, like August 2004 as discussed in one of our weather-climate discussions on the ESRL/PSD MJO web site). Should this less probable scenario happen, it is currently outside the envelope range of uncertainty sampled any of the operational global models (multi-model ensemble spread). Again, this emphasizes the need for a weather-climate linkage diagnostic component (the GSDM) including daily monitoring to correctly making subseasonal predictions as part of a complete forecast process. Multi-model ensembles alone are not enough, particularly considering their biases, data assimilation issues, not predicting tropical convection correctly after about day 5, etc…………..
There is little change in my outlooks for weeks 1-3 (through ~24 August). The “wicked ridge of the west” will expand into the Deep South and eastern USA as the westerlies come southward into the Rockies and Plains downstream from the western USA trough. A reversal of the temperature and precipitation anomalies observed across much of the country for the last 4-6 weeks may occur. Severe MCS activity with flooding rainfall is likely from the Northern Plains into the Ohio Valley periodically through at least the middle of this month. This “storm track” should slowly shift south. Intense heat may focus on the south central into the mid-Atlantic states, along with high dewpoints.
Internationally, severe thunderstorms and heavy rainfall are probable from southern China into the Philippines at least weeks 1-2. Additional typhoon activity is probable for the TNWP weeks 1-3, possibly impacting locations such as China and Japan. Finally, tropical waves moving west from Africa have been recently intensifying. However, for numerous reasons I am now unclear about the risk of tropical cyclone development across the North Atlantic Ocean at least through week 2. The latter is yet another example why there is not a linear relationship between La-Nina basic states and an increased risk of North Atlantic tropical cyclone activity, at least subseasonally.
Appendix
An experimental quasi-phase space plot of the GSDM utilizing a time series of normalized relative AAM tendency anomaly (Y-axis) and normalized relative AAM anomaly time series (X-axis) can be found at
http://www.cdc.noaa.gov/map/images/gcm/gsdm_95d.jpg
http://www.cdc.noaa.gov/map/images/gcm/gsdm_40d.jpg
We call the behavior exhibited by this plot the Global Wind Oscillation (GWO), and one of its purposes is to extend thinking beyond the MJO.These are probabilistic statements, and work is ongoing to quantify in future posts. We hope that an opportunity will arise for us to have a dedicated web page effort to expedite more objectively, with rigor, thoroughness and verification. The WB (2007) paper on the GSDM has been published in the February issue of MWR.
My next posting will not be until late next week since I have to cover a set of overnight shifts. In general, due to covering shifts and travel, my discussions will be irregular through at least the end of this month.
Ed Berry
Tuesday, July 31, 2007
Slay the Beast
Per CPC data, sea surface temperature anomaly (SSTA) magnitudes throughout much of the global tropics are still generally less than 2C with warmth across the Indian and west central Pacific Oceans and coolness along the east Pacific equatorial cold tongue. Exceptions include ~2-3C just east of Africa and west of South America. Totals across the central Indian and west central Pacific Oceans are ~29-30C. Recent 5-day averaged TAO buoy data suggests considerable warming of subsurface anomalies along the equatorial east Pacific cold tongue, with magnitudes ~minus 1C at roughly 100m. The horseshoe spatial distribution of warm SSTAs across the west Pacific Ocean also persists. The largest anomalies and warmest SSTs are across the tropical northwest Pacific (TNWP) from the region of the South China Sea (SCS) to west of the date line. Totals remain ~30-31C.
As discussed below, the global circulation continues to behave in a La-Nina like manner (which may be traced back to subseasonal events boreal fall 2006). However, as I have been stating for a few weeks, my own feelings are the coolest SST anomalies will remain across the East Pacific and this will not be a basin wide situation. The SSTs across the west central and TWNP as well as much of the Indian Ocean are warmer than normal and will continue to impact the global circulation. The positive SST anomalies across the west Pacific warm pool are deep and have been persistent for at least the past 5-7 years.
In contrast to some past writings, I only want to summarize recent subseasonal forcing-response-feedbacks, etc. for brevity. Several monitoring tools including renditions of Wheeler and Hendon (2004) phase space plots from various international operational weather centers (ESRL/PSD MJO web page) indicate the MJO signal has virtually collapsed. We need to be careful what we are trying to interpret.
A convectively coupled Kelvin wave moved into the west central Pacific Ocean over the last week or so. Extratropical Rossby wave energy dispersions from East Asia interacting with the convection produced a local environment favorable for the development of Typhoon Usagi. I think this Kelvin wave signal is moving across the equatorial Western Hemisphere and may be contributing the recent increase of the Andes Mountain torque to ~plus 20 Hadleys per 28 July R1 data. However, I also think the global circulation component of what may still be a MJO signal remains across the Eastern Hemisphere centered ~90-100E. Various animations of wind fields support this notion, with loosely twin anomalous upper tropospheric tropical/subtropical anticyclones from Africa into the Indian Ocean and twin cyclones across eastern Indonesia to the date line. I think the tropical convection will respond to these circulation anomalies meaning a reorganization and slow east-northeast shift (coherent modes Hovmollers support this).
Full disk satellite imagery presents a nice signal this process is occurring. Intense tropical rainfall currently extends from India east-southeast to the equatorial west central Pacific Ocean, having 3-day averaged OLRA ~minus 50-90 W/m**2 centered near 5-10N/110E. I think it is probable to have very intense tropical convection across the warm SSTs of the northwest Pacific Ocean by roughly week 3. This may involve a consolidation of tropical forcing from both the west central equatorial Pacific and a slowly eastward propagating mode.
Total global AAM (28 July) is ~3 standard deviations below the R1 data climatology. Only around 1 March 2007 may have been lower than this value during the past 12 months. The low AAM is not only for the troposphere but also includes the easterly phase of the QBO and the earth component. Irrelevant of how anyone wants to do a real-time earth-atmosphere AAM budget, deep anomalous zonal mean easterly flow dominates much of the tropical and subtropical atmospheres, with incursions into the midlatitudes during July. From a zonal mean perspective, existing higher latitude westerly wind flow anomalies poleward of the easterlies have supported strong midlatitude ridges, including the wicked ridge of the western USA this summer. This circulation situation is consistent with La-Nina (GSDM Stage 1).
Currently both global frictional and mountain torques are increasing. These dynamical processes are already starting to add westerly flow to the atmosphere. As the tropical convection shifts into the northwest Pacific, I think this behavior through interactions with the extratropics and the earth’s surface will add additional westerly flow to the subtropics. This should result in a strong positive AAM tendency and the Global Wind Oscillation (GWO) should orbit toward GSDM Stage 2 during the time period of weeks 2-3. Again, uncertainty is huge including timing, considering the stochastic nature of the dynamical system we are dealing with. However, after a week of very intensive daily monitoring, my confidence in this scenario is increasing. In fact, more and more ensemble numerical models are becoming supportive (NCEP GFS, ERSL/PSD, etc.). In another manner of speaking, I have been offering this option in these discussions for at least a week, and now the numerical models may be starting to catch-up to what diagnostic reasoning suggests as a more probable scenario.
For the PNA sector this suggests the possibility of a major circulation change for especially the USA, meaning an anomalous western USA trough and southeast states ridge. At least for the subseasonal time scale, perhaps the beastly “wicked ridge of the west” will be “dead”. A reversal of the temperature and precipitation anomalies observed across much of the country for the last 4-6 weeks may occur. Internationally, severe thunderstorms and heavy rainfall are probable from southern China into the Philippines at least weeks 1-2. Additional typhoon activity is probable for the TNWP weeks 2-3, possibly impacting locations such as China and Japan. Finally, tropical waves moving west from Africa have been recently intensifying. The risk of tropical cyclone development across the North Atlantic Ocean may increase above climatology going into week 2.
In a somewhat longer term, ~weeks 3-6, I am getting concerned we may start to observe 2 regions of Eastern Hemisphere tropical convective forcing once again, the Indian and west central Pacific Oceans. If the former dominates, GSDM Stage 4-1 would be most probable. Should the GWO orbit to Stage 2 during the next few weeks, it may quickly circuit to the Stage4-1 quasi phase space plane. Stay tuned.
Appendix
An experimental quasi-phase space plot of the GSDM utilizing a time series of normalized relative AAM tendency anomaly (Y-axis) and normalized relative AAM anomaly time series (X-axis) can be found at
http://www.cdc.noaa.gov/map/images/gcm/gsdm_95d.jpg
http://www.cdc.noaa.gov/map/images/gcm/gsdm_40d.jpg
We call the behavior of this plot the Global Wind Oscillation (GWO), and one of its purposes is to extend thinking beyond the MJO.These are probabilistic statements, and work is ongoing to quantify in future posts. We hope that an opportunity will arise for us to have a dedicated web page effort to expedite more objectively, with rigor, thoroughness and verification. The WB (2007) paper on the GSDM has been published in the February issue of MWR. I will try to at least briefly update this Blog on Friday (3 August). In general, due to covering shifts and travel, my postings will be irregular through at least August.
Ed Berry
As discussed below, the global circulation continues to behave in a La-Nina like manner (which may be traced back to subseasonal events boreal fall 2006). However, as I have been stating for a few weeks, my own feelings are the coolest SST anomalies will remain across the East Pacific and this will not be a basin wide situation. The SSTs across the west central and TWNP as well as much of the Indian Ocean are warmer than normal and will continue to impact the global circulation. The positive SST anomalies across the west Pacific warm pool are deep and have been persistent for at least the past 5-7 years.
In contrast to some past writings, I only want to summarize recent subseasonal forcing-response-feedbacks, etc. for brevity. Several monitoring tools including renditions of Wheeler and Hendon (2004) phase space plots from various international operational weather centers (ESRL/PSD MJO web page) indicate the MJO signal has virtually collapsed. We need to be careful what we are trying to interpret.
A convectively coupled Kelvin wave moved into the west central Pacific Ocean over the last week or so. Extratropical Rossby wave energy dispersions from East Asia interacting with the convection produced a local environment favorable for the development of Typhoon Usagi. I think this Kelvin wave signal is moving across the equatorial Western Hemisphere and may be contributing the recent increase of the Andes Mountain torque to ~plus 20 Hadleys per 28 July R1 data. However, I also think the global circulation component of what may still be a MJO signal remains across the Eastern Hemisphere centered ~90-100E. Various animations of wind fields support this notion, with loosely twin anomalous upper tropospheric tropical/subtropical anticyclones from Africa into the Indian Ocean and twin cyclones across eastern Indonesia to the date line. I think the tropical convection will respond to these circulation anomalies meaning a reorganization and slow east-northeast shift (coherent modes Hovmollers support this).
Full disk satellite imagery presents a nice signal this process is occurring. Intense tropical rainfall currently extends from India east-southeast to the equatorial west central Pacific Ocean, having 3-day averaged OLRA ~minus 50-90 W/m**2 centered near 5-10N/110E. I think it is probable to have very intense tropical convection across the warm SSTs of the northwest Pacific Ocean by roughly week 3. This may involve a consolidation of tropical forcing from both the west central equatorial Pacific and a slowly eastward propagating mode.
Total global AAM (28 July) is ~3 standard deviations below the R1 data climatology. Only around 1 March 2007 may have been lower than this value during the past 12 months. The low AAM is not only for the troposphere but also includes the easterly phase of the QBO and the earth component. Irrelevant of how anyone wants to do a real-time earth-atmosphere AAM budget, deep anomalous zonal mean easterly flow dominates much of the tropical and subtropical atmospheres, with incursions into the midlatitudes during July. From a zonal mean perspective, existing higher latitude westerly wind flow anomalies poleward of the easterlies have supported strong midlatitude ridges, including the wicked ridge of the western USA this summer. This circulation situation is consistent with La-Nina (GSDM Stage 1).
Currently both global frictional and mountain torques are increasing. These dynamical processes are already starting to add westerly flow to the atmosphere. As the tropical convection shifts into the northwest Pacific, I think this behavior through interactions with the extratropics and the earth’s surface will add additional westerly flow to the subtropics. This should result in a strong positive AAM tendency and the Global Wind Oscillation (GWO) should orbit toward GSDM Stage 2 during the time period of weeks 2-3. Again, uncertainty is huge including timing, considering the stochastic nature of the dynamical system we are dealing with. However, after a week of very intensive daily monitoring, my confidence in this scenario is increasing. In fact, more and more ensemble numerical models are becoming supportive (NCEP GFS, ERSL/PSD, etc.). In another manner of speaking, I have been offering this option in these discussions for at least a week, and now the numerical models may be starting to catch-up to what diagnostic reasoning suggests as a more probable scenario.
For the PNA sector this suggests the possibility of a major circulation change for especially the USA, meaning an anomalous western USA trough and southeast states ridge. At least for the subseasonal time scale, perhaps the beastly “wicked ridge of the west” will be “dead”. A reversal of the temperature and precipitation anomalies observed across much of the country for the last 4-6 weeks may occur. Internationally, severe thunderstorms and heavy rainfall are probable from southern China into the Philippines at least weeks 1-2. Additional typhoon activity is probable for the TNWP weeks 2-3, possibly impacting locations such as China and Japan. Finally, tropical waves moving west from Africa have been recently intensifying. The risk of tropical cyclone development across the North Atlantic Ocean may increase above climatology going into week 2.
In a somewhat longer term, ~weeks 3-6, I am getting concerned we may start to observe 2 regions of Eastern Hemisphere tropical convective forcing once again, the Indian and west central Pacific Oceans. If the former dominates, GSDM Stage 4-1 would be most probable. Should the GWO orbit to Stage 2 during the next few weeks, it may quickly circuit to the Stage4-1 quasi phase space plane. Stay tuned.
Appendix
An experimental quasi-phase space plot of the GSDM utilizing a time series of normalized relative AAM tendency anomaly (Y-axis) and normalized relative AAM anomaly time series (X-axis) can be found at
http://www.cdc.noaa.gov/map/images/gcm/gsdm_95d.jpg
http://www.cdc.noaa.gov/map/images/gcm/gsdm_40d.jpg
We call the behavior of this plot the Global Wind Oscillation (GWO), and one of its purposes is to extend thinking beyond the MJO.These are probabilistic statements, and work is ongoing to quantify in future posts. We hope that an opportunity will arise for us to have a dedicated web page effort to expedite more objectively, with rigor, thoroughness and verification. The WB (2007) paper on the GSDM has been published in the February issue of MWR. I will try to at least briefly update this Blog on Friday (3 August). In general, due to covering shifts and travel, my postings will be irregular through at least August.
Ed Berry
Subscribe to:
Posts (Atom)