Thursday, August 07, 2008

The Day the Atmosphere "Stood Still" ???

The views expressed are those of the author and do not necessarily represent those of the National Weather Service.”


Please keep in mind the ESRL/PSD GSDM web link, below, while reading this discussion.


http://www.cdc.noaa.gov/map/clim/gsdm.composites.shtml


The 90-day signal to noise ratio anomaly composites are now updated daily, centered on the date shown (see product descriptions). Stay tuned as our work slowly moves forward. Again, this effort is a work in progress with extremely limited resources.


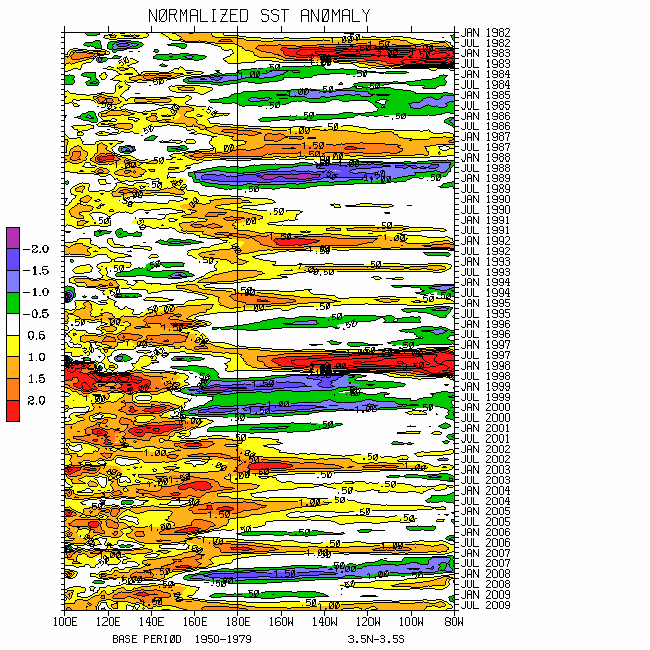
The warmest SSTs globally are centered on the tropical northwest Pacific Ocean ~10-20N/150E having totals ~29-30C. The anomalous warm and cool horseshoes of SSTs remain across the Pacific Ocean basin, along with the positive anomalies across the equatorial east Pacific. Broadly similar to the last 2 boreal summers, a positive-negative-positive anomaly spatial SST pattern is present from the Indian Ocean to the west central Pacific Ocean. SSTs across much of the tropical Atlantic Ocean basin are well above climatology.


The general consensus in regard to the interannual component is “ENSO neutral”. Regardless of “labeling”, constant evolutionary dynamical processes involving all components of the weather-climate system continue. These include complex subseasonal processes, and will contribute to additional high impact weather globally. I do remain concerned that a renewed tilt toward a low AAM base state (a “weakened rendition” of the 2007-08 La-Nina) is the most probable outcome for at least the next 3-6 months (more said below). See the following links for SST details.


http://www.wmo.int/pages/prog/wcp/wcasp/enso_update_latest.html


http://iri.columbia.edu/climate/ENSO/currentinfo/technical.html


http://www.pmel.noaa.gov/tao/jsdisplay/


http://www.cdc.noaa.gov/forecast1/IndoPacific.frcst.html (note the initial projection)


http://www.cpc.ncep.noaa.gov/products/precip/CWlink/MJO/index.primjo.html (link 18)


http://www.cdc.noaa.gov/map/images/sst/sst.long.time.gif


Eastern Hemisphere enhanced tropical convective forcing has shifted well north, extending from approximately northern India/Pakistan (where flooding deaths have occurred) through southeast China into the northwest Pacific Ocean. The core of this activity is at ~15-20N/120E, with recent 3-day averaged OLRA less than minus 90 W/m**2 per BMRC. Tied to the Southern Hemisphere extratropics, flare-ups continue over the anomalously warm west central equatorial Indian Ocean. There has also been an increase of tropical convection along Pacific Ocean ITCZ as well as the Americas during the last few days.


WH (2004) MJO plots updated through 6 August, while showing a slightly less than 1 sigma projection in octant 2 of phase space without the base state left in, present a somewhat greater than 1 standard deviation signal with the interannual component. As was suggested by many MJO predictions in WH (2004) phase space at least a week ago, a westward shift of this tropical signal has occurred. I think much of the signal has come from the winds (tied to the processes explained by WB (2008) GWO).


In any case, not only must users carefully understand the derivation of the empirical WH (2004) technique and related predictive tools, but much more importantly the dynamics responsible for the recent behavior of this tropical forcing. The bottom line is I think coupling between the tropics and extratropics is still present meaning the now familiar low AAM quasi-stationary component to the global weather-climate situation may be (again) starting to dominate. Going into the boreal cold season, subseasonal processes may change this.


The enhancement across the Western Hemisphere can be attributed to faster processes such as convectively coupled Kelvin waves (per coherent modes Hovmollers) and those linked with the WB (2008) GWO. I do have more confidence relative to my 1 August posting this Western Hemisphere signal of enhanced tropical forcing will not be as robust as ~late May and early July.


Through 5 August global relative AAM (including the westerly phase of the stratospheric QBO) was slightly below the R1 data climatology with its computed tendency ~minus 10 Hadleys forcing the WB (2008) GWO to roughly octant 8-1 of phase space. Since approximately 20 July a relatively fast orbit has been occurring. One contributor has been the global mountain torque, with the positive East Asian component (~10 Hadleys) out of phase with the global signal. The latter is very complicated (but explainable), and has been a characteristic feature of our low AAM base state for the past several months. Regardless, I think the current Western Hemisphere tropical convective signal is partly a response to this fast WB (2008) GWO. The trough that most models predict to impact the USA during roughly days 4-7 is also a response to the fast WB (2008) GWO including the positive East Asian mountain torque.


Zonal mean westerly wind flow anomalies (~5m/s at 200mb) have shifted off the equator to roughly 15N, while 5-10m/s anomalous zonal mean easterly wind flow anomalies persist in the subtropical atmospheres. In fact, anomalous midlatitude ridges are again present across the global midlatitudes, having a zonally oriented character across the Northern Hemisphere. The latter is characteristic of a Branstator (2002) circumglobal teleconnection (and is also connected to the recent negative NAO phase – red noise!!!), as observed frequently during the boreal 2007-08 cold season.


Specifically, everything considered (this discussion is already too long!!!), WB (2008) GWO and WH (2004) MJO phase 3 streamfunction (psi) and 2m air temperature anomaly composites best describe the current global weather-climate situation. Animations of upper tropospheric daily mean vector wind anomalies show twin anticyclones becoming better defined in the region of Africa/Indian Ocean with downstream twin cyclones. This supports the notion of a low AAM quasi-stationary regime, as well as the composites I am “pointing to”.


Weeks 1-3 across the USA should see synoptic events featuring troughs digging into the middle of the country, then moving to the East Coast. Ridging is most probable in the region of the west coast. I think the 2m air temperature anomaly pattern given by WB (2008) GWO phase 3 may be the most representative, on average. However, there will be orbits in phase space, and keep in mind other GWO/MJO composites such as phases 2 and 4. Phases 5-7 are the least likely. Similar to the last few days, intense rainfall and MCS activity (including severe local storms) will continue to periodically impact much of the central and eastern portions of the country. I think the latest official week-2 forecast is too dry for much of the middle USA, especially the Upper Mississippi Valley and particularly around Iowa. The increasing subtropical westerly wind flow mentioned above supports wetness from the Desert Southwest into the Plains.


Should this low AAM quasi stationary component (key word) of the global circulation regime persist well into the boreal 2008-09 cold season, outcomes of USA temperature and precipitation anomalies having some similarity to 2007-08 are again possible. The barrage of western USA troughs may resume. One difference may be for wetness to expand farther south into the Plains given what may be increased subtropical westerly wind flow (I have my reasons).


Intense to severe tropical thunderstorm activity should increase across the equatorial Indian Ocean during the next 1-3 weeks while expanding northeast into the monsoon and frontal band systems. Given the very warm SSTs, the tropical northwest Pacific Ocean is likely to remain periodically active, including an elevated risk of tropical cyclones. In fact, both the Indian and west Pacific Oceans may be anomalously convectively active going into boreal autumn. Stay tuned to see if our "old nemesis of the new world atmosphere" returns. The central and east Pacific Oceans will have a tropical cyclone risk at least week 1, while the Atlantic basin may get into the act weeks 2-3 (Saharan dust understood).


Please see the latest official tropical cyclone forecasts for all basins. I trust the expertise of the appropriate meteorological centers to alert the public of additional weather hazards worldwide.


Appendix


Links to CPC and PSD ENSO discussions:


http://www.cpc.ncep.noaa.gov/products/analysis_monitoring/enso_advisory/index.shtml


http://www.cdc.noaa.gov/people/klaus.wolter/MEI/


The following is a link to information about the stratosphere and other nice monitoring tools:


http://ds.data.jma.go.jp/tcc/tcc/products/clisys/index.html


The following is a link to NCEP model verifications (surf around for lots more).


http://www.cpc.ncep.noaa.gov/schemm/z500ac_wk2_na.html .


The following is a link discussing recent global weather and related events.


http://www.wmo.ch/pages/mediacentre/news/index_en.html


These are probabilistic statements. We hope that an opportunity will arise for us (soon) to allow our dedicated web page effort to mature, expediting objectively and accountability. This web page effort will hopefully include an objective predictive scheme for the GWO with hindcasts.


The WB (2007) paper on the GSDM has been published in the February issue of MWR. In addition, the first of a two-part paper has been submitted to MWR where WB formally introduce the GWO. A pdf version can be downloaded from the following link:


http://www.cdc.noaa.gov/map/clim/wb08_final.pdf


Overlapping seasonally varying subseasonal composites for variables such as surface temperature, precipitation, geopotential height and streamfunction anomalies are planned on being posted on the web site mentioned above and presented in part-2 of our paper. We want to emphasize notions such as global-zonal mean-regional scale linkages as well as forcing-response-feedback (with subsequent interactions) relationships. An important purpose is to provide a dynamical weather-climate linkage framework to evaluate the numerical models in a sophisticated manner as part of a subseasonal (and any time scale) forecast process, in addition to a climate service for all users. Relying on the numerical models alone is a cookbook!


Given shift work and travel, updates are extremely difficult. I hope to do another discussion next weekend, ~15-17 August.


Ed Berry

Friday, August 01, 2008

What goes around...or does it?

The views expressed are those of the author and do not necessarily represent those of the National Weather Service.”


Please keep in mind the ESRL/PSD GSDM web link, below, while reading this discussion.


http://www.cdc.noaa.gov/map/clim/gsdm.composites.shtml


The composites are still centered on 1 July, and work is on-going to update them regularly. Stay tuned. Again, this effort is a work in progress with extremely limited resources.


The following are links to global SST information. Weak warm SST anomalies (~0.5C per TAO buoy data) continue from the west coast of South America into the equatorial East Pacific Ocean. Surface westerly wind anomalies partially forced by the extratropics has persisted these positive SST anomalies. However, these anomalies are not very deep. Having my reasons, I think a significant equatorial Pacific Ocean basin wide warm event (El-Nino) is unlikely during the upcoming 2008-09 boreal cold season.


http://www.wmo.int/pages/prog/wcp/wcasp/enso_update_latest.html


http://iri.columbia.edu/climate/ENSO/currentinfo/technical.html


http://www.pmel.noaa.gov/tao/jsdisplay/


http://www.cdc.noaa.gov/forecast1/IndoPacific.frcst.html (note the initial projection)


http://www.cpc.ncep.noaa.gov/products/precip/CWlink/MJO/index.primjo.html (link 18)


http://www.cdc.noaa.gov/map/images/sst/sst.long.time.gif


As was offered on my 23 July posting, Eastern Hemisphere tropical convective forcing has been slowly propagating east-northeast toward the northwest Pacific Ocean (~5-6m/s phase speed). Full disk satellite imagery shows this enhanced rainfall extending from India east-southeast to north of New Guinea, centered on approximately the Philippines. Forced by the Southern Hemisphere extratropics, separate flare-ups continue over the western equatorial Indian Ocean. The latter has been a recurring feature since at least early June. WH (2004) MJO plots through 31 July indicate a slightly less than 1 sigma projection in octant 4 of phase space (w/wo interannual component), having little eastward movement during the last few days (more said below).


During the last half of July dynamical processes tied to the tropical convection and the extratropics worked to add global westerly wind flow. In fact, relative AAM peaked just above the R1 data climatology ~30 July. Anomalous zonal mean westerly wind flow was generated in the northern equatorial atmosphere around mid-July, only to propagate poleward and downward since. The latter has been in the presence of other midlatitude zonal bands of anomalous westerly wind flow. Particularly in the austral winter Southern Hemisphere storm track regions, frictional dissipation of this westerly wind flow has been occurring over the last couple of weeks. In fact, the zonal mean frictional torque anomaly around 25S has been minus 2 Hadleys and lower.


Continuing, my point is that I think once again westerly wind flow is decreasing globally. For example, Rossby wave energy dispersions (RWDs) tied to the Eastern Hemisphere tropical convective forcing arcing across the South Pacific Ocean is contributing to a strong negative Andes mountain torque. That along with other complicated dynamical processes (to save space!) has forced the global relative AAM tendency to roughly minus 20 Hadleys allowing the WB (2008) GWO to orbit solidly into octant 8-1 of phase space (averaging period issues understood).


One bottom line for predictive purposes is that I do expect a signal having a MJO component to propagate through the Western Hemisphere during the next few weeks. Most statistical and dynamical MJO forecasts utilizing the WH (2004) methodology do not support this notion very well.


However, I think it is less likely there will be the strong enhancement around the Americas as observed ~mid June-mid July. In addition to dynamical forcing from extratropical RWDs, I think the latter may have involved some constructive interference between an equatorial Atlantic convectively coupled Rossby mode and the previous MJO. The Rossby mode may have been a response to what was persistent tropical convective forcing across the eastern equatorial Atlantic Ocean during boreal late winter-spring. Above average SSTs, perhaps due to an "Atlantic El-Nino", contributed to that enhanced convection.


Another bottom line is that the quasi-stationary component to our global circulation base state favoring a low AAM regime has not completely gone away. The recurring convective flare-ups over the western equatorial Indian Ocean per above is a manifestation of this. Hence I do think the WB (2008) GWO is probable to loosely orbit tilted toward phase 3 (La-Nina base state) “until further notice”. In fact, I remain concerned some reprisal of the “2007-08 season of the witch” may occur this upcoming boreal cold season.


On my 23 July discussion I suggested with low confidence a “pattern shift of sorts” across the USA may occur favoring a ridge around the west coast and a trough in the middle of the country going into this month. None of the numerical models or official predictions suggested this. Latest model runs now favor a situation similar to this regional scale response for next week. Hence the intense heat that is about to expand eastward across the central and eastern states is probable to last only a few days.


However, my feelings for success of this subseasonal prediction are limited and mixed. I was favoring a stationary pattern given by phases 3-4 of the GWO 250mb psi and temperature anomaly composites. Instead, a relatively large orbit in GWO phase space occurred.


For weeks 1-3, interestingly enough, with variations understood, phases 3-4 and 4-5 of the GWO anomaly composites (250mb psi and temperature) along with MJO temperature anomaly phases 4 and 5 appear to be the most probable outcome for the country. Again, these are composite signals and need to be updated. Also, given recent relatively weak weather-climate signals and a tendency for “fading in and out (not discussed)”, my confidence remains low.


As the Plains cool down next week, intense MCS activity may shift southward impacting locations from eastern Colorado-Wyoming into at least Iowa and Missouri. The MCS storm track is probable to shift back to the northeast as intense heat may return to the Central and Southern Plains weeks 2-3. Other locations possibly impacted by periods of heavy rainfall and severe local storms are portions of the eastern states weeks 1-3.


Intense to severe tropical thunderstorm activity should shift east and north through portions of India, Southeast Asia and the northwest Pacific Ocean during the next 1-2 weeks. Locations that may be hardest hit include the South China Sea and the Philippines into the west central Pacific Ocean. Going along will be the risk of tropical cyclone development. Persistent tropical forcing is also likely across the western equatorial Indian Ocean. During weeks 2-3, while tropical thunderstorm activity may weaken slightly across the Eastern Hemisphere, some enhancement is likely over the Americas. The risk of tropical cyclones may increase across the East Pacific Ocean week-2 and Atlantic by week-3 (above climatology).


Please see the latest official tropical cyclone forecasts for all basins. I trust the expertise of the appropriate meteorological centers to alert the public of additional weather hazards worldwide.


Appendix


Links to CPC and PSD ENSO discussions:


http://www.cpc.ncep.noaa.gov/products/analysis_monitoring/enso_advisory/index.shtml


http://www.cdc.noaa.gov/people/klaus.wolter/MEI/


The following is a link to information about the stratosphere and other nice monitoring tools:


http://ds.data.jma.go.jp/tcc/tcc/products/clisys/index.html


The following is a link to NCEP model verifications (surf around for lots more).


http://www.cpc.ncep.noaa.gov/schemm/z500ac_wk2_na.html


The following is a link discussing recent global weather and related events.


http://www.wmo.ch/pages/mediacentre/news/index_en.html


These are probabilistic statements. We hope that an opportunity will arise for us (soon) to allow our dedicated web page effort to mature, expediting objectively and accountability. This web page effort will hopefully include an objective predictive scheme for the GWO with hindcasts.


The WB (2007) paper on the GSDM has been published in the February issue of MWR. In addition, the first of a two-part paper has been submitted to MWR where WB formally introduce the GWO. A pdf version can be downloaded from the following link


http://www.cdc.noaa.gov/map/clim/wb08_final.pdf


Overlapping seasonally varying subseasonal composites for variables such as surface temperature, precipitation, geopotential height and streamfunction anomalies are planned on being posted on the web site mentioned above and presented in part-2 of our paper. We want to emphasize notions such as global-zonal mean-regional scale linkages as well as forcing-response-feedback (with subsequent interactions) relationships. An important purpose is to provide a dynamical weather-climate linkage framework to evaluate the numerical models in a sophisticated manner as part of a subseasonal (and any time scale) forecast process, in addition to a climate service for all users. Relying on the numerical models alone is a cookbook!


Given shift work and travel, updates are extremely difficult. I hope to do another discussion late next week.


Ed Berry

Wednesday, July 23, 2008

Burn the Cookbooks!!!

The views expressed are those of the author and do not necessarily represent those of the National Weather Service.”


Please keep in mind the ESRL/PSD GSDM web link, below, while reading this discussion.


http://www.cdc.noaa.gov/map/clim/gsdm.composites.shtml


The general thought is “ENSO neutral conditions with some lingering effects of La-Nina circulation” for at least the next few months. While in the views of many there is some truth to a statement such as the latter, care must be taken not to overlook the always important details of the subseasonal dynamics (which do impact seasonal outcomes). For instance, one response has been the warming of the equatorial east Pacific Ocean during the last several months, perhaps reflective of a “~year (-1) of a Rasmussen and Carpenter (1982) warm event scenario”. Please see links below, and stay tuned.


http://www.wmo.int/pages/prog/wcp/wcasp/enso_update_latest.html


http://iri.columbia.edu/climate/ENSO/currentinfo/technical.html


http://www.pmel.noaa.gov/tao/jsdisplay/


http://www.cdc.noaa.gov/forecast1/IndoPacific.frcst.html (note the initial projection)


http://www.cpc.ncep.noaa.gov/products/precip/CWlink/MJO/index.primjo.html (link 18)


http://www.cdc.noaa.gov/map/images/sst/sst.long.time.gif


As expected, Eastern Hemisphere tropical convective forcing has become quite intense, currently centered ~5N/100E. Most numerical and statistical MJO prediction schemes did a poor job with this evolution. Reasons include a failure to capture the role of extratropical dynamical processes explained by the WB (2008) GWO. Continuing, there was also difficulty for many week-2 numerical ensembles to predict the extratropics, with the ACC of the NCEP GFS dipping well below zero for the North American sector. The latter are well known issues by WB, and hopefully an opportunity will arise to quantify it statistically.


Three-day averaged OLRA have exceeded minus 90 W/m**2 with the Indian Ocean severe thunderstorm clusters. The area of enhanced tropical rainfall is oriented northeast-southwest, not only enhancing the monsoon systems, but also frontal bands even across southeast China. Per WH (2004) phase space diagrams, there is a less than 1 sigma MJO projection in octant 3. Leaving the interannual component in, the projection is greater than 1 standard deviation, which is more realistic. I do expect this tropical forcing to continue propagating east and north during the next 1-3 weeks.


During the last couple of weeks there has been some attempt to rejuvenate our low AAM base state. Leaving the westerly QBO phase in, global relative AAM dipped to roughly 1 AMU below the R1 data climatology earlier this month. With the classic transition of Eastern Hemisphere tropical upper tropospheric circulation anomalies to Indian Ocean (west Pacific Ocean) anticyclones (cyclones), equatorial Pacific westerly wind flow anomalies have appeared (roughly 20-25m/s around the date line). Particularly for the Southern Hemisphere, there has been poleward propagation of zonal mean zonal wind flow anomalies including easterlies shifting into the subtropical atmospheres.


These are only a handful of many reasons why global relative AAM tendency spiked to ~plus 20 Hadleys forcing the WB (2008) GWO into approximately octant 4 of phase space on 20 July. Both AAM tendency and the GWO are headed back down (through 21 July), and whether the rejuvenation discussed above is a longer term signal remains unclear (not to contradict other weather-climate signals).


Broadly, there continues to be good tropical-extratropical coupling, including interhemispheric meridional symmetry of zonal mean zonal wind anomalies favoring anomalous midlatitude ridges. Comparing recent daily mean 150mb vector wind anomalies to the MJO composites, phase 3 of 250mb psi is loosely representative (“apples and oranges” issues understood). For instance, there is a well defined Rossby wave energy dispersion (RWD) signal from the west Pacific Ocean cyclones that links up the trough-ridge-trough pattern across North America.


The careful reader will also see these signals in the GWO composites. Avoiding more length and confusion, there is ~50 day period between the recent minima in the time series of the global frictional torque. This leads to the point that decay time scale processes explained by the WB (2008) GWO are currently at least as equally important as any MJO contribution. Hence my feeling (one reason) why the notions suggested by the phase 3-4 composites of the GWO may be representative for roughly weeks 2-3. We need to remember these composites are still centered on 1 July (should be updated soon), and that using these must be defended on sound scientific reasoning, not “shoe horned”. In any case, this thought is consistent with my discussion posted on 12 July.


For the North American sector, perhaps ~days 10-20 (roughly 2-13 August) ridge amplification off the west coast into Alaska leading to an approximate reversal of circulation anomalies across the USA is a possibility. My confidence in this scenario is not high; however, I feel it should be “put on the table”. There is little suggestion of this scenario from the models and certainly the official USA week-2 forecast. In fact, the suggestion of warmth officially across the northern states is also inconsistent with the MJO signal. The "meteorological reasoning" for the official week-2 forecast is based on seemingly subjectively blending various models, including deterministic runs (my dog (angry Rottweiler) does not like this!).


The probable USA temperature patterns can be seen from the 2m air composite signals. However things pan out, a shift toward below normal air temperatures from the Great Lakes extending southward toward the Central Plains should be considered. Once again, locations periodically focusing on the Northern and Central Plains into the Ohio Valley are the most probable storm track for MCS activity. Other locations possibly impacted by periods of heavy rainfall and severe local storms are portions of the eastern states.


Intense to severe tropical thunderstorm activity should shift east and north through portions of India and Southeast Asia during the next 1-2 weeks. Included are frontal bands across southeast China. By week-3 the most intense tropical convection may focus on the northwest Pacific Ocean including the South China Sea and the Philippines. The tropical cyclone hazard may also increase for these areas. Whether or not convection also propagates eastward along the equator to near the date line is unclear (may cause an equatorial westerly wind burst). The tropical cyclone hazard for the Western Hemisphere should be diminished weeks 1-2 (hybrids always understood, including the one currently northeast of the Philippines).


Please see the latest official tropical cyclone forecasts for all basins. I trust the expertise of the appropriate meteorological centers to alert the public of additional weather hazards worldwide.


Appendix


Links to CPC and PSD ENSO discussions:


http://www.cpc.ncep.noaa.gov/products/analysis_monitoring/enso_advisory/index.shtml


http://www.cdc.noaa.gov/people/klaus.wolter/MEI/


The following is a link to information about the stratosphere and other nice monitoring tools:


http://ds.data.jma.go.jp/tcc/tcc/products/clisys/index.html


The following is a link to NCEP model verifications (surf around for lots more)


http://www.cpc.ncep.noaa.gov/schemm/z500ac_wk2_na.html


The following is a link discussing recent global weather and related events


http://www.wmo.ch/pages/mediacentre/news/index_en.html


These are probabilistic statements. We hope that an opportunity will arise for us (soon) to allow our dedicated web page effort to mature, expediting objectively and accountability. This web page effort will hopefully include an objective predictive scheme for the GWO with hindcasts.


The WB (2007) paper on the GSDM has been published in the February issue of MWR. In addition, the first of a two-part paper has been submitted to MWR where WB formally introduces the GWO. A pdf version can be downloaded from the following link


http://www.cdc.noaa.gov/map/clim/wb08_final.pdf


Overlapping seasonally varying subseasonal composites for variables such as surface temperature, precipitation, geopotential height and streamfunction anomalies are planned on being posted on the web site mentioned above and presented in part-2 of our paper. We want to emphasize notions such as global-zonal mean-regional scale linkages as well as forcing-response-feedback (with subsequent interactions) relationships. An important purpose is to provide a dynamical weather-climate linkage framework to evaluate the numerical models in a sophisticated manner as part of a subseasonal (and any time scale) forecast process, in addition to a climate service for all users. Relying on the numerical models alone is a cookbook!


Given shift work and travel, updates are extremely difficult. I hope to do another discussion around the weekend of 2-3 August.


Ed Berry

Saturday, July 12, 2008

Another Weather-Climate Crossroad

The views expressed are those of the author and do not necessarily represent those of the National Weather Service.”


Following the lead started last week, please keep in mind the ESRL/PSD GSDM web link, below, while reading this discussion.


http://www.cdc.noaa.gov/map/clim/gsdm.composites.shtml


Below are the links to various sources of global SST information. Overall, any interannual component of variability involving the SSTs is still unclear. There are some aspects similar to a year ago appearing such as the loose spatial pattern of anomalous warm-cool-warm of equatorial/tropical SSTs from the Indian Ocean into the west central Pacific Ocean. There has been little change since at least a week ago.


http://www.wmo.int/pages/prog/wcp/wcasp/enso_update_latest.html


http://iri.columbia.edu/climate/ENSO/currentinfo/technical.html


http://www.pmel.noaa.gov/tao/jsdisplay/


http://www.cdc.noaa.gov/forecast1/IndoPacific.frcst.html (note the initial projection)


http://www.cpc.ncep.noaa.gov/products/precip/CWlink/MJO/index.primjo.html (link 18)


http://www.cdc.noaa.gov/map/images/sst/sst.long.time.gif


Full disk satellite imagery and other tools used to help understand evolutionary processes still indicate multiple regions of enhanced tropical convective forcing. Similar to a week ago, they include the equatorial Indian Ocean into the Eastern Hemisphere monsoon systems and the eastern Pacific Ocean ITCZ into the Americas. Some important differences, however, are increased suppression over the west central Pacific Ocean and a significant increase in coverage and intensity along the equator over the Indian Ocean. In fact, latest 3-day averaged OLRA for the latter are ~minus 70-90 W/m**2. This increase of Indian Ocean forcing was expected a week ago, linked to the dynamics of complicated Rossby wave energy dispersions (RWDs) arcing through the extratropics, particularly the Southern Hemisphere (more said below).


As I have been also expecting to happen for at least the past 2 weeks, global relative AAM is decreasing. In fact, ~7 July the calculated relative AAM tendency was ~minus 30 Hadleys. This was one of the largest negative magnitudes since December 2007. In contrast to the computed tendency (GWO2), the latter takes into consideration the zonal mean AAM transport signal. Updated through 10 July relative AAM was roughly 1 AMU below the R1 data climatology with the calculated tendency of ~minus 10 Hadleys.


While not feasible to discuss the details here, from daily monitoring and working to have a better understanding of the dynamics involved, I feel fairly comfortable offering attribution to this recent AAM behavior. Much of this removal of global westerly wind flow has been through frictional dissipation of poleward and downward propagation of zonal mean westerly wind flow anomalies into the midlatitude storm track regions for at least the past several weeks. That has been especially true of the Southern Hemisphere, given austral winter, having zonal mean negative frictional torque anomalies of more than 2 Hadleys ~50-60S contributing to a global frictional torque of ~minus 20 Hadleys around 1 July. Interesting question to ask is if this behavior is a loose mirror image to what occurred last February for boreal winter? The point is this type of understanding helps to anticipate subseasonal behaviors including the MJO, as part of the GWO. All numerical models will do generally poorly with these types of processes even after a few days into their prediction cycles.


Updated through 10 July, both the WH (2004) and WB (2008) measures of the MJO and GWO respectively had similar locations in phase space. Both were in approximately octant 1 having projections greater than 1 sigma. I think there is good coupling between the tropics and extratropics, including (again) arguably meridional symmetry of zonal mean zonal wind anomalies. As bands of zonal mean westerly wind flow anomalies shift poleward through the extratropical atmospheres, easterly wind anomalies are increasing in the tropical and subtropical atmospheres. This all goes “hand in hand” with the MJO dynamical signal of tropical convective forcing starting to return to the Eastern Hemisphere, particularly the Indian Ocean.


Referring to the GWO and MJO composites for ~250mb streamfunction (psi) and 2m air temperature, the ongoing progressive synoptic trough currently in the central USA and the model predictions of another for the USA Pacific Northwest are consistent with roughly phases 1-2. Most week-2 ensembles were predicting the current trough to dig into the western USA, which did not occur (another issue).


While unclear about the time scale, I do think the spatial patterns depicted by especially GWO phases 3-4 is where the global circulation is going. My suspicion for the latter is ~weeks 3-4 (by early August). Until then, the patterns illustrated by MJO phases 2-3 may be the best offering of a prediction roughly weeks 1-2. The bottom line is I still have my concerns for some rejuvenation of the low AAM base state going into the upcoming boreal cold season. Obviously exact weather ramifications are unclear. Statements like, “ENSO neutral with lingering La-Nina circulation”, while perhaps currently true, tell you nothing about the critically important global subseasonal dynamics (as measured by the GWO).


The probable USA temperature patterns per above can be seen from the 2m air temperature composite signals. Again, remember these are composites and individual cases can be much stronger. Locations periodically focusing on the Northern Plains into the Ohio Valley are the most probable storm track for MCS activity. That includes more heavy rainfall for locations such as Iowa and the Upper Mississippi Valley.


Intense to severe tropical thunderstorm activity is probable to increase from the equatorial Indian Ocean into the monsoon systems and frontal bands of India and Asia during the next few weeks. The west and northwest Pacific Ocean will remain a “wild card”, including the possibility of tropical cyclone spin-ups threatening the Philippines and Southeast Asia. The East Pacific Ocean tropical cyclone hazard should wane by week-2.


Anomalous upper tropospheric twin tropical anticyclones are well defined across the Western Hemisphere, while they slowly propagate through Africa into the Indian Ocean. This situation is favorable for additional strong African easterly waves. Please see the latest official tropical cyclone forecasts for all basins. I trust the expertise of the appropriate meteorological centers to alert the public of additional weather hazards worldwide.


Appendix


Links to CPC and PSD ENSO discussions:


http://www.cpc.ncep.noaa.gov/products/analysis_monitoring/enso_advisory/index.shtml


http://www.cdc.noaa.gov/people/klaus.wolter/MEI/


The following is a link to information about the stratosphere and other nice monitoring tools:


http://ds.data.jma.go.jp/tcc/tcc/products/clisys/index.html


The following is a link to NCEP model verifications (surf around for lots more).


http://www.cpc.ncep.noaa.gov/schemm/z500ac_wk2_na.html .


The following is a link discussing recent global weather and related events.


http://www.wmo.ch/pages/mediacentre/news/index_en.html


These are probabilistic statements. We hope that an opportunity will arise for us (soon) to allow our dedicated web page effort to mature, expediting objectively and accountability. This web page effort will hopefully include an objective predictive scheme for the GWO with hindcasts.


The WB (2007) paper on the GSDM has been published in the February issue of MWR. In addition, the first of a two-part paper has been submitted to MWR where WB formally introduces the GWO. A pdf version can be downloaded from the following link


http://www.cdc.noaa.gov/map/clim/wb08_final.pdf


Overlapping seasonally varying subseasonal composites for numerous variables including surface temperature, precipitation, geopotential height and streamfunction anomalies are planned on being posted on the web site mentioned above and presented in part-2 of our paper. We want to emphasize notions such as global-zonal mean-regional scale linkages as well as forcing-response-feedback (with subsequent interactions) relationships. An important purpose is to provide a dynamical weather-climate linkage framework to evaluate the numerical models in a sophisticated manner as part of a subseasonal (and any time scale) forecast process, in addition to a climate service for all users. Relying on the numerical models alone is a cookbook!


Given shift work and travel, updates are extremely difficult. An update is unlikely next weekend, 19-20 July. I hope to do another discussion ~23 July.


Ed Berry