Global equatorial SSTs (per CPC) are generally above average with the exception of weak cool anomalies (~minus 1C) west of South America. The warmest waters with totals of ~29-31C are still present from the west central into the Northwest Pacific Ocean extending to 25 deg. N latitude. Totals across the Indian Ocean are ~29C while the tropical Atlantic Ocean has warmed to roughly 28C. The spatial horseshoe pattern of anomalous warmth continues to emanate out of the west central Pacific into the extratropics of both of hemispheres, with magnitudes in excess of 2 deg C across the Tropical Northwest Pacific (TNWP).
East of the date line along the equator, latest 5-day averaged TAO buoy data shows respectable negative anomalies at depths of approximately 100-250m, with ~minus 5C at about 150m/150W. This is an imprint from the trade wind surge of a couple of weeks ago when the oceanic thermocline was lifted. Weak warm anomalies remain just above that cool layer, and it is unclear whether or not these cool anomalies will surface. Whatever the case, for now, a tilt toward weak La-Nina conditions with respect to the interactions between the tropical oceans and circulation responses for the next 1-3 months is probable.
Tropical convective forcing has increased significantly along the equatorial west central Pacific Ocean during the last few days, with OLRA ~minus 50 W/m**2 centered ~140-150E. The MJO discussed in past writings has contributed to this increase. However, as will be discussed, I think we are losing our MJO signal. Tied to a much stronger than normal South Asian monsoon system, other intense areas of rainfall remains from the northern Arabian Sea into Southeast Asia centered ~15N. In fact, there has been a rapid increase of convection southwest of India that is probable to move north and contribute to additional flooding and other related hazards for that region. Finally, there has been a reasonably coherent convectively coupled Kelvin wave moving through the Western Hemisphere during the last week or so. I think this Kelvin wave may have contributed to the recent Andes Mountain torque of ~20 Hadleys and may also be adding to the local increase of thunderstorm activity across both the African Highlands and the Southwest Indian Ocean. Overall, one can state that the dominate region of tropical convective forcing is across the Eastern Hemisphere extending from the region of Pakistan east-southeast into the west central Pacific Ocean.
So, does the above sufficiently describe current situation of tropical convective forcing? I do not think so. I am leaning toward the notion of an emerging stationary pattern of enhanced tropical rainfall having 2 regions (as discussed in previous posts): the South Asian monsoon system and the TNWP. I think we are going to be hard pressed to see any real coherent MJOs the rest of this boreal summer. Yes, there will likely be more convectively coupled Kelvin waves bleeding into the Western Hemisphere enhancing rainfall around the Americas at times. The current flare-up of west central Pacific tropical convection is likely to shift northwest during the next 1-3 weeks, and a few tropical cyclones are probable as this occurs. There are already weak surface westerly wind anomalies along and just north of the equator in this region, with anomalous twin upper tropospheric subtropical anticyclones developing.
The global circulation response is complicated. It is only from detailed daily monitoring within the GSDM framework I think I can make some sense of it. I do want to be brief describing it. From the animations of fields such as ESRL/PSD 150mb and 250mb daily mean vector wind anomalies and totals during the last several weeks, anomalous upper tropospheric westerly wind flow of ~15-25m/s still persists across the Western Hemisphere. The largest magnitudes of these westerly anomalies are from the date line to South America, with weekly mean anomalies in excess of 25m/s. There are 2 pairs of subtropical anticylones and cyclones not only linked to the tropical forcing discussed above, but also from extratropical feedbacks. One pair of anticylones (cyclones) is ~40-60E (~80E) with the other ~140-150E (just east of the date line). Interacting with the extratropics, Rossby wave energy dispersions from the Indian Ocean (west central Pacific) pair have led to the observed strong ridges across the North Pacific (North Atlantic) during the last couple of weeks. Both of these regions of forcing, with a wet Indian Ocean and a dry west Pacific, have contributed to the intense North America ridge.
These complex interactions have allowed propagation of the well above average equatorial zonal mean upper tropospheric westerly wind flow into the subtropical and extratropical atmospheres, particularly the Southern Hemisphere given austral winter. In fact, during the last week very intense storm track activity has occurred from Australia into the South Pacific. Other ramifications has included an anomalously intense North Atlantic Jet (NAJ) with daily mean anomalies ~40m/s at times. This NAJ has contributed to the recent storminess much of the United Kingdom has experienced. Finally, the added westerly flow has also intensified the jet across southern Asia, which is now interacting with the intensifying tropical convection across the west central Pacific. It is probable that the latter will lead to a retrogression of the North American ridge possibly into the east Pacific during the next few weeks.
Including the contribution from the current easterly phase of the stratospheric Quasi-Biennial Oscillation (QBO), global relative AAM through 30 June per R1 data was slightly below normal, while just above climatology without the QBO. AAM tendency was roughly plus 20 Hadleys with a global mountain torque of ~15 Hadleys giving some contribution. With reduced trades and increased zonal mean surface westerly flow tied to intensified storm track activity across both hemispheres, global frictional torque was near average.
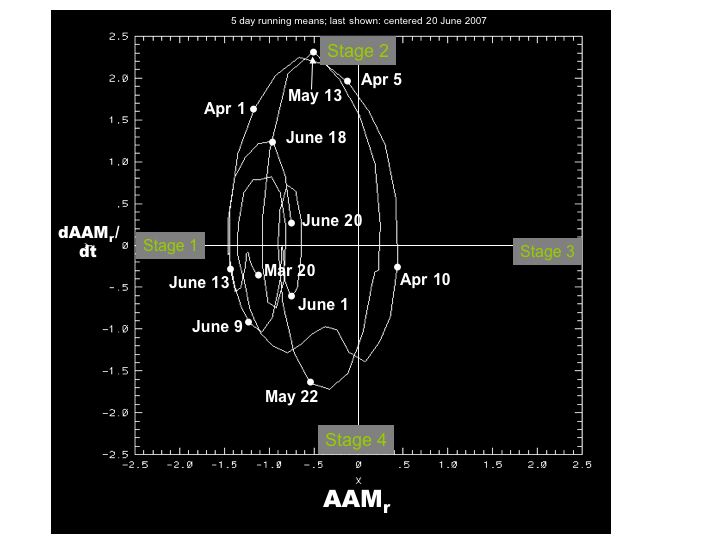
Summing up, I see the intensification of the west central Pacific tropical convection as a major development. This is helping to maintain some of the anomalous upper tropospheric zonal mean westerly wind flow anomalies, hence the recent positive AAM tendency. The Global Wind Oscillation (GWO) is orbiting toward GSDM Stage 2, and I would agree the current weather-climate situation is best described by that Stage. Given 10-30 day mountain-frictional torque index cycles (not discussed today) and the likelihood of additional Western Hemisphere convectively coupled Kelvin waves, a GWO circuit (magnitude unclear) through Stages 3-4 then 1 is a possibility during the next 1-3 weeks. However, I think a stationary to slowly evolving component of the global circulation will dominate until further notice. Additionally, as we go into boreal fall and the South Asian monsoon systems shut down, unlike fall 2006 when the Indian Ocean forcing was the strongest, the west central Pacific Ocean tropical convective forcing may start to dominate given the anomalous expanse and depth of the warm pool ocean water. That may start an evolution to El-Nino at some point. However, I want to emphasize that uncertainty remains huge, not only for the possibility of El-Nino development, but even the subseasonal predictions I am offering today.
There is little change from my previous 2 discussions to the international ramifications of the current weather-climate situation. Tropical cyclone risks will remain for the Bay of Bengal and even the Arabian Sea for at least the next couple of weeks. The west central and TNWP is already starting to fester with development, and could become a major concern by weeks 2-3 possibly threatening Japan ~week 3. Kelvin waves may periodically excite the East Pacific and even the Atlantic at times. In fact, there is currently an area of disturbed weather about 1500 miles east of Windward Islands per TPC that could become a depression during the next day or so. While drought persists across western Indonesia, severe thunderstorms and flooding rainfall are likely to rake areas from Pakistan into Southeast Asia and China.
The discontinuous retrogression of the North American Ridge into possibly the East Pacific Ocean (~140W) by week 3 should bring some relief from the intense heat across the Interior West. More and more ensemble prediction schemes from various global operational centers are catching on to this notion. However, much of that region particularly west of the Continental Divide looks generally dry. The Northern Plains into the Great Lakes are likely to see increasing intense to possibly severe MCS activity starting early next week. Some of this thunderstorm activity may spread southward during week 2 with trough development across roughly the Plains. For locations around Texas, slow relief from the recent flooding rainfall should occur starting next week, maybe sooner. However, for anywhere across the Plains between the Front Range of the Rockies and Mississippi River, severe flooding rainfall events could occur almost “anytime” given the persistent above average moisture transport through the Gulf of Mexico. Temperatures are most probable to tilt toward near-below normal across the middle of country with above normal summertime heat across the Deep Southeast.
Appendix
An experimental phase space plot of the GSDM (which we call a Global Wind Oscillation (GWO)) utilizing normalized relative AAM time tendency (Y-axis) and normalized relative AAM (X-axis) can be found at
http://www.cdc.noaa.gov/map/images/gcm/gsdm_95d.jpg
These are probabilistic statements, and work is ongoing to quantify in future posts. We hope that an opportunity will arise for us to have a dedicated web page effort to expedite more objectively. The WB (2007) paper on the GSDM has been published in the February issue of MWR. I may not be able to post another discussion until late next week or early on the following week due to travel. Please check. In general, due to covering shifts and travel, my postings on this Blog will be irregular through at least August.
Ed Berry
Tuesday, July 03, 2007

Friday, June 29, 2007
Let's Focus on the Weather
At the time of this writing, ESRL/PSD AAM R1 plots contain data through 26 June and the GWO only through 25 June.
I wish I could answer all questions from recent emails. However, until we have a properly supported dedicated web page effort allowing a focus on efforts such as weather-climate linkage research and subseasonal forecasting; my timeliness to help folks will be significantly impacted. There have been numerous recent extreme weather events globally including across the USA (Texas floods, western heat, etc.), and it is unfortunate that improved predictive information cannot be provided to users who need to make weather sensitive decisions. I want (tried!) to make the following relatively short; including not repeating the issues discussed 26 June.
Global SSTs remain similar to earlier this week. Subsurface anomalies along the equatorial Pacific have cooled to ~minus 4C at ~160W/100m. However, these remain detached from the surface and are the result of the thermocline being raised by the recent anomalously strong (~10m/s) trade wind surge. The tropical west central and northwest Pacific (TNWP) SST totals remain ~29-31C, with a horseshoe pattern of positive anomalies extending into at least the subtropics of both hemispheres.
The main show of tropical convective forcing remains across the Eastern Hemisphere centered ~15-20N/100-110E while extending from the far northern Arabian Sea east-southeast into the extreme TWNP. At least one weak tropical cyclone developed across the Bay of Bengal (BB) during this week while Yemyin ravaged portions of Pakistan (WMO news). The envelope of this tropical forcing has been shifting east-northeast for the last couple of weeks, having an eastward component of ~3-4m/s. I think this is a weak MJO signal, and I also think this will increase tropical thunderstorm activity across portions of the TNWP during the next couple of weeks. In fact, full disk satellite imagery does present a signal of increasing tropical convection from around the Philippines to just west of the date line. There has also been a slight increase in convection over the tropical East Pacific while flare-ups remain along the western equatorial Indian Ocean. The former is tied to a convectively coupled Kelvin wave while the latter is linked to the South Asian Monsoon system.
GSDM Stage 1 still best describes the weather-climate situation. Animations of upper tropospheric daily mean vector wind anomalies through 28 June (FNL data) shows subtropical twin anticyclones ~120E with downstream twin cyclones just east of the date line while stationary twin anticyclones remain across Africa and weak twin lows over the western Atlantic. Wind speed anomalies are ~15-25m/s over the subtropical atmospheres with these features, with magnitudes still ~30m/s of the equatorial westerlies west of South America. Interacting with fast subtropical baroclinic wave packets and extratropical Rossby wave energy dispersions, I can see that at least “some” of the recent strong anomalous Western Hemisphere upper tropospheric equatorial westerly wind flow has propagated into the extratropics, particularly the South Hemisphere. The inability of these equatorial westerlies to nicely come back around into the Eastern Hemisphere may be tied to frictional dissipation. However, there has been recent anomalous flux convergence of AAM transports of ~.6 Hadleys ~40N (with Southern Hemisphere symmetry). In a very complicated way from watching the wind animations, I do think there is some linkage between these AAM transports and the anomalous equatorial westerlies.
Global relative AAM remains ~1 standard deviation below the R1 climatology while the global tendency and mountain torque are near zero. While decreasing, global frictional torque is still ~plus 10 Hadleys but with negative zonal mean anomalies ~40N and 30S. Finally, zonal mean anomalous easterly flow that was across the equatorial latitudes a few weeks ago has now propagated poleward to ~35N but with anomalous zonal mean westerlies to the north and south (magnitudes ~5-10m/s at 200mb).
My thoughts where the atmosphere is going remain unchanged from 26 June. I think tropical forcing will increase across the warm TNWP during the next couple of weeks, perhaps extending from Southeast Asia to ~5-10N/160-170E by the end of week 2. Meanwhile, thunderstorm activity is likely to remain periodically intense for locations centered ~India and the BB. Yes, there may be see 2 separate regions of tropical forcing per previous discussions. The future of any MJO signal is unclear. The Wheeler phase space plot indicates a weak projection moving toward Africa, which, for now, I think is unrealistic.
I would expect the Global Wind Oscillation to show a turn from GSDM Stage 1 to possibly Stage 2 depending on how intense any convection becomes across the TNWP. The added midlatitude westerly flow per above suggests the possibility of an intense trough ~160W of the North Pacific leading to a retrogression and intensification/amplification of the western North American ridge by the start of week 2. I also think there is a possibility for this wicked western USA devil ridge to shift back into the eastern Pacific while amplifying into Alaska weeks 3-4. In fact, there are even a few ensemble members from the numerical models that indicate this. Finally, going out on a limb per longer time scale variations discussed 26 June, I could even see a pattern reversal during August for the west and central USA while the Deep South ridge goes “no where”.
In the meantime, this scenario is not good news for the Interior West for at least weeks 1-2 given extreme/record heat, fire weather and drought concerns. Anticyclonically wave breaking lows across the Southern Plains will keep the flooding rainfall threat for especially Texas while the Northern Plains-Upper Mississippi Valley has generally cool and increasing wet conditions weeks 1-2. In fact, severe MCS activity may focus on states like Iowa starting week 2. Albeit optimistic by most, some relief from the heat may occur for the Interior West weeks 3-4.
Internationally, tropical cyclone threats may be a concern for weeks 1-2 across the East Pacific, TNWP including the Philippines, and even the BB. In fact, surface westerly wind flow anomalies are developing across the far west central Pacific suggestive of an increasing tropical cyclone threat in that region. The tropical Atlantic should remain suppressed. Flooding rainfall and severe thunderstorms show no let up for the areas across South Central and Southeast Asia already hit hard the last several weeks as does the onslaught of cold/wet conditions for especially Eastern Australia.
Appendix
An experimental phase space plot of the GSDM (which we call a Global Wind Oscillation (GWO)) utilizing normalized relative AAM time tendency (Y-axis) and normalized relative AAM (X-axis) can be found at
http://www.cdc.noaa.gov/map/images/gcm/gsdm_95d.jpg
These are probabilistic statements, and work is ongoing to quantify in future posts. We hope that an opportunity will arise for us to have a dedicated web page effort to expedite more objectively. The WB (2007) paper on the GSDM has been published in the February issue of MWR. I will try to post another discussion early next week. Due to covering shifts and travel, my postings on this Blog will be irregular through at least August.
Ed Berry
I wish I could answer all questions from recent emails. However, until we have a properly supported dedicated web page effort allowing a focus on efforts such as weather-climate linkage research and subseasonal forecasting; my timeliness to help folks will be significantly impacted. There have been numerous recent extreme weather events globally including across the USA (Texas floods, western heat, etc.), and it is unfortunate that improved predictive information cannot be provided to users who need to make weather sensitive decisions. I want (tried!) to make the following relatively short; including not repeating the issues discussed 26 June.
Global SSTs remain similar to earlier this week. Subsurface anomalies along the equatorial Pacific have cooled to ~minus 4C at ~160W/100m. However, these remain detached from the surface and are the result of the thermocline being raised by the recent anomalously strong (~10m/s) trade wind surge. The tropical west central and northwest Pacific (TNWP) SST totals remain ~29-31C, with a horseshoe pattern of positive anomalies extending into at least the subtropics of both hemispheres.
The main show of tropical convective forcing remains across the Eastern Hemisphere centered ~15-20N/100-110E while extending from the far northern Arabian Sea east-southeast into the extreme TWNP. At least one weak tropical cyclone developed across the Bay of Bengal (BB) during this week while Yemyin ravaged portions of Pakistan (WMO news). The envelope of this tropical forcing has been shifting east-northeast for the last couple of weeks, having an eastward component of ~3-4m/s. I think this is a weak MJO signal, and I also think this will increase tropical thunderstorm activity across portions of the TNWP during the next couple of weeks. In fact, full disk satellite imagery does present a signal of increasing tropical convection from around the Philippines to just west of the date line. There has also been a slight increase in convection over the tropical East Pacific while flare-ups remain along the western equatorial Indian Ocean. The former is tied to a convectively coupled Kelvin wave while the latter is linked to the South Asian Monsoon system.
GSDM Stage 1 still best describes the weather-climate situation. Animations of upper tropospheric daily mean vector wind anomalies through 28 June (FNL data) shows subtropical twin anticyclones ~120E with downstream twin cyclones just east of the date line while stationary twin anticyclones remain across Africa and weak twin lows over the western Atlantic. Wind speed anomalies are ~15-25m/s over the subtropical atmospheres with these features, with magnitudes still ~30m/s of the equatorial westerlies west of South America. Interacting with fast subtropical baroclinic wave packets and extratropical Rossby wave energy dispersions, I can see that at least “some” of the recent strong anomalous Western Hemisphere upper tropospheric equatorial westerly wind flow has propagated into the extratropics, particularly the South Hemisphere. The inability of these equatorial westerlies to nicely come back around into the Eastern Hemisphere may be tied to frictional dissipation. However, there has been recent anomalous flux convergence of AAM transports of ~.6 Hadleys ~40N (with Southern Hemisphere symmetry). In a very complicated way from watching the wind animations, I do think there is some linkage between these AAM transports and the anomalous equatorial westerlies.
Global relative AAM remains ~1 standard deviation below the R1 climatology while the global tendency and mountain torque are near zero. While decreasing, global frictional torque is still ~plus 10 Hadleys but with negative zonal mean anomalies ~40N and 30S. Finally, zonal mean anomalous easterly flow that was across the equatorial latitudes a few weeks ago has now propagated poleward to ~35N but with anomalous zonal mean westerlies to the north and south (magnitudes ~5-10m/s at 200mb).
My thoughts where the atmosphere is going remain unchanged from 26 June. I think tropical forcing will increase across the warm TNWP during the next couple of weeks, perhaps extending from Southeast Asia to ~5-10N/160-170E by the end of week 2. Meanwhile, thunderstorm activity is likely to remain periodically intense for locations centered ~India and the BB. Yes, there may be see 2 separate regions of tropical forcing per previous discussions. The future of any MJO signal is unclear. The Wheeler phase space plot indicates a weak projection moving toward Africa, which, for now, I think is unrealistic.
I would expect the Global Wind Oscillation to show a turn from GSDM Stage 1 to possibly Stage 2 depending on how intense any convection becomes across the TNWP. The added midlatitude westerly flow per above suggests the possibility of an intense trough ~160W of the North Pacific leading to a retrogression and intensification/amplification of the western North American ridge by the start of week 2. I also think there is a possibility for this wicked western USA devil ridge to shift back into the eastern Pacific while amplifying into Alaska weeks 3-4. In fact, there are even a few ensemble members from the numerical models that indicate this. Finally, going out on a limb per longer time scale variations discussed 26 June, I could even see a pattern reversal during August for the west and central USA while the Deep South ridge goes “no where”.
In the meantime, this scenario is not good news for the Interior West for at least weeks 1-2 given extreme/record heat, fire weather and drought concerns. Anticyclonically wave breaking lows across the Southern Plains will keep the flooding rainfall threat for especially Texas while the Northern Plains-Upper Mississippi Valley has generally cool and increasing wet conditions weeks 1-2. In fact, severe MCS activity may focus on states like Iowa starting week 2. Albeit optimistic by most, some relief from the heat may occur for the Interior West weeks 3-4.
Internationally, tropical cyclone threats may be a concern for weeks 1-2 across the East Pacific, TNWP including the Philippines, and even the BB. In fact, surface westerly wind flow anomalies are developing across the far west central Pacific suggestive of an increasing tropical cyclone threat in that region. The tropical Atlantic should remain suppressed. Flooding rainfall and severe thunderstorms show no let up for the areas across South Central and Southeast Asia already hit hard the last several weeks as does the onslaught of cold/wet conditions for especially Eastern Australia.
Appendix
An experimental phase space plot of the GSDM (which we call a Global Wind Oscillation (GWO)) utilizing normalized relative AAM time tendency (Y-axis) and normalized relative AAM (X-axis) can be found at
http://www.cdc.noaa.gov/map/images/gcm/gsdm_95d.jpg
These are probabilistic statements, and work is ongoing to quantify in future posts. We hope that an opportunity will arise for us to have a dedicated web page effort to expedite more objectively. The WB (2007) paper on the GSDM has been published in the February issue of MWR. I will try to post another discussion early next week. Due to covering shifts and travel, my postings on this Blog will be irregular through at least August.
Ed Berry
Tuesday, June 26, 2007
Orbiting Around Stage 1?
Note, the ESRL/PSD R1 AAM plots only have data through 6/22
It is current situations like the present that make writing these postings extremely difficult. For example, the shorter wavelengths of boreal summer are contributing to some of the difficulties(in addtion to my steep learning curve). There are also slowly evolving components that I can “trace back” to December 2006 and even 2002 that I think are also adding to the complexity. Understanding the latter requires disciplined daily monitoring within the GSDM diagnostic framework to have any real hope of improving our understanding of the atmosphere and making better week 1-4 and beyond predictions. At least from speculation, I actually have some comfort where I think the atmosphere is going during the next few weeks and perhaps much longer. If we had a dedicated properly supported web page effort I am confident what I offer below would be more objective (and complete) and not speculation.
Per CPC daily mean analysis, SSTs remain well above average from the west central into the northwest Pacific Ocean with widespread anomalies ~0.5-2C and totals from 29-31C. The warmest waters remain across the South China Sea (SCS). Most of the equatorial Indian Ocean including the Arabian Sea has cooled during the last few weeks given the recent intense tropical rainfall. However, weak warm anomalies are still present along the equator in that region. The trade wind surge during the last week-10 days across the equatorial date line and central Pacific Ocean cooled the SSTs by ~.5-1C. In fact, per TAO data, the oceanic thermocline has been raised east of the date line leading to ~minus 3C anomalies at ~150W/150m. This region of subsurface cool water remains detached from the near normal SSTs above them and the weakly cool anomalies west of South America. Above average SSTs still remain southwest of Mexico into the Caribbean (totals ~28-30C) as well as the eastern Tropical Atlantic (totals ~27-28C).
Again, development of La-Nina remains uncertain. However, we think a tilt toward weakly La-Nina conditions this summer followed by a transitional situation by winter is an option. This notion is partly based on the biennial character of the occurrences of warm and cold events (loosely) since the 2000-01 boreal winter. Also, a strong El-Nino may be “looming”.
The MJO dynamical signal has weakened significantly. For the example, the zonal wave number 1 spatial pattern of tropical/subtropical 200mb velocity potential anomalies has broken up into regional structures during the last few days. In addition, many phase space plots involving the first 2 EOFs of a mutivariate MJO index (equatorially averaged OLRA, 850mb and 200mb vector wind anomalies) no longer show a MJO projection. However, there is still significant tropical convective forcing occurring across the Eastern Hemisphere, and this has and will continue to impact the extratropics until further notice.
Coherent modes Hovmollers suggest that the recent intensification of convection across the west central Pacific may have been linked to a convectively coupled Kelvin wave. Meanwhile, these same plots still show a MJO projection across the northern subtropics centered ~10N/100E per full disk satellite imagery. In fact, a back of the envelope phase speed calculation gives me an eastward propagation of ~4m/s since early this month. Whatever the case (and to save space), we did get our separation of the tropical forcing as discussed a week ago (with weak tropical cyclones across both the Arabian Sea and Bay of Bengal). My feeling is some the tropical forcing centered ~10N/100E will shift generally eastward into the exceptionally warm Tropical Northwest Pacific (TNWP) including the SCS, while convection still remains active possibly as far west as India and the Bay of Bengal (above climatology). I think a component moving into the TNWP is reasonable given there have been ~30-day periods of suppression then enhancement of west Pacific Ocean tropical convection going back to January 2007 linked to extratropical variations.
Restating, from an atmospherics dynamics viewpoint I think the Eastern Hemisphere monsoon systems have become well established, particularly the South Asian system. Animations of daily mean 150mb vector wind anomalies show well developed twin tropical anticyclones from Africa into the Indian Ocean having recent weekly mean anomalies in excess of 20m/s across the Southern Hemisphere (per FNL data). The Webster-Yang index (which also considers the Somalia Jet) shows recent negative vertical wind shear of ~25m/s supporting this observation. The point is the recent intense Indian Ocean tropical forcing (which I can also trace back as a westward shift from central Pacific Ocean forcing starting in January 2007) has fed back to the atmosphere and I think the atmosphere will feedback with additional convection in that region in spite of cooler SSTs. My suspicion is there may be a relatively stationary signal of tropical forcing centered ~10-15N/120-140E starting ~week 2 and continuing through the rest of this summer. Of course, an equally valid option is the 2 regions discussed last week, meaning there is still huge uncertainly. Again, whatever the details it appears probable the Eastern Hemisphere will “call the shots” the rest of this summer, and is one of our reasons for a tilt toward weak La-Nina conditions.
Animations of upper tropospheric daily mean wind fields also present an emerging signal of anomalous twin tropical/subtropical anticyclones ~120E. This is a fundamental change from a week ago where cyclones were present. I think this change is the result of the eastward propagation of the convection north of the equator discussed above. Rossby wave energy dispersions from the extratropics have maintained anomalous upper tropospheric Western Hemisphere equatorial westerly wind flow with weekly means ~25-30m/s west of South America. Tied to this westerly flow are subtropical cyclones just east of the date line and even across the western Atlantic. The AAM tendency zonal mean anomaly plot as well as time-latitude sections of 200mb zonal mean zonal wind anomalies show this anomalous westerly flow is propagating into the subtropical atmospheres, especially the Southern Hemisphere. As I type a summertime version of the East Asia Jet is expanding into the North Pacific as a response.
So, where is the atmosphere going? For the past couple of weeks I have maintained there would be an evolution to GSDM Stage 2 leading to a cool/wet regime focused on the central USA. As of ~18 June, per Global Wind Oscillation (GWO) phase space and R1 global AAM tendency plots, GSDM Stage 2 represented the weather-climate situation. Tied to the very strong subtropical westerly flow discussed above and extratropical Rossby wave energy dispersions linking both the recent Indian Ocean forcing to the anticyclonically wave breaking subtropical central Pacific lows, the PNA trough-ridge-trough pattern I expected set up is going to be about 20-30 degrees of longitude farther east. These same Rossby wave energy dispersions led to the current negative phase of the NAO and recent anomalous ridges across the North Atlantic Ocean. The model forecasts of ridge conditions across the Rockies a couple of weeks ago were correct; however, there has been a catch-up game to the magnitude of the amplitude tied to the dynamics discussed above. A cooler and wetter situation is becoming established across the central states but for a somewhat different synoptic evolution than I advertised a week ago. This serves as another example where this type of predictive information must be expressed probabilistically since synoptic details and timing are white noise after about 5 days (as is the prediction of tropical convection by the models).
As of the 20 June the GWO phase space plot (5-day average) has started an orbit back toward GSDM Stage 1. The global AAM tendency on 22 June was barely positive since (in addition to other terms) both the global mountain and frictional torques started to decrease. The former has a contribution from lowering mean sea-level pressures (MSLP) across East Asia while the latter is from the trades gradually weakening. Global AAM is still ~1 standard deviation below the R1 climatology, and the frictional torque itself remains well above average (~15 Hadleys). Linked to the Eastern Hemisphere tropical forcing I suspect MSLP anomalies across East Asia may become strongly negative during the next week helping to drive down the global mountain torque to well below normal. This may be part of the ~40 day variations of the global mountain torque discussed in past postings. This will drive AAM tendency downward and may force the GWO close to Stage 4 (if this has not already happened). Overall, orbits (magnitudes unclear) around GSDM Stage 1 may be story the rest of this summer.
What this means to me is there should be a relaxation of the anomalous Western Hemisphere equatorial and subtropical upper tropospheric westerly wind flow. It is not unreasonable to expect anomalous zonal mean easterly flow developing throughout the tropics during the next few weeks. Finally, the East Asian Jet (for this time of year) should retract allowing the USA trough-ridge-trough pattern to retrograde after week 1. Interestingly, this notion is consistent with the statement posted in my 22 June discussion, “However, a more probable offering would suggest circulation anomalies to then consolidate leading to a ridge west of North America and a trough across the central part of the USA by week 3.” More ensemble members are starting to suggest this possibility. It would not surprise me to see enough retrogression to allow even an anomalous trough (well against climatology) across the western USA ~weeks 3-4 for a period of time should the Eastern Hemisphere tropical forcing remain stationary and very intense.
International weather ramifications suggest little change for those portions of India into Southeast Asia and China recently ravaged by severe thunderstorms and flooding rainfall for at least the next 1-2 weeks. Tropical cyclones may become a concern weeks 2-4 for the TNWP, and I cannot rule out another Bay of Bengal “surprise”. Convectively coupled Kelvin waves may enhance convection along the East Pacific ITCZ by week 2 while the tropical Atlantic remains “quiet” weeks 1-2.
The generally warm/dry west-southeast and cool/wet south central-northeast USA situation looks intact week 1. I think we will see the ridge amplify closer to the west coast week 2 and possibly back into the East Pacific ~140W weeks 3-4. Whatever the details, I feel confident this regime is retrogressive. During weeks 2-3 intense/severe summertime MCS activity with flooding rainfall may become an issue throughout much of the central USA along with the anomalously cool conditions. Most of the Far West is likely to stay “very hot” and dry through much of week 2, with maybe some relief weeks 3-4 should a trough set up for a period of time. Portions of the Deep South are probable to have above normal summertime heat with relatively suppressed diurnal thunderstorm activity.
Appendix
An experimental phase space plot of the GSDM (which we call a Global Wind Oscillation (GWO)) utilizing normalized relative AAM time tendency (Y-axis) and normalized relative AAM (X-axis) can be found at
http://www.cdc.noaa.gov/map/images/gcm/gsdm_95d.jpg
These are probabilistic statements, and work is ongoing to quantify in future posts. We hope that an opportunity will arise for us to have a dedicated web page effort to expedite more objectively. The WB (2007) paper on the GSDM has been published in the February issue of MWR. I will try to post another discussion this Friday.
Ed Berry
It is current situations like the present that make writing these postings extremely difficult. For example, the shorter wavelengths of boreal summer are contributing to some of the difficulties(in addtion to my steep learning curve). There are also slowly evolving components that I can “trace back” to December 2006 and even 2002 that I think are also adding to the complexity. Understanding the latter requires disciplined daily monitoring within the GSDM diagnostic framework to have any real hope of improving our understanding of the atmosphere and making better week 1-4 and beyond predictions. At least from speculation, I actually have some comfort where I think the atmosphere is going during the next few weeks and perhaps much longer. If we had a dedicated properly supported web page effort I am confident what I offer below would be more objective (and complete) and not speculation.
Per CPC daily mean analysis, SSTs remain well above average from the west central into the northwest Pacific Ocean with widespread anomalies ~0.5-2C and totals from 29-31C. The warmest waters remain across the South China Sea (SCS). Most of the equatorial Indian Ocean including the Arabian Sea has cooled during the last few weeks given the recent intense tropical rainfall. However, weak warm anomalies are still present along the equator in that region. The trade wind surge during the last week-10 days across the equatorial date line and central Pacific Ocean cooled the SSTs by ~.5-1C. In fact, per TAO data, the oceanic thermocline has been raised east of the date line leading to ~minus 3C anomalies at ~150W/150m. This region of subsurface cool water remains detached from the near normal SSTs above them and the weakly cool anomalies west of South America. Above average SSTs still remain southwest of Mexico into the Caribbean (totals ~28-30C) as well as the eastern Tropical Atlantic (totals ~27-28C).
Again, development of La-Nina remains uncertain. However, we think a tilt toward weakly La-Nina conditions this summer followed by a transitional situation by winter is an option. This notion is partly based on the biennial character of the occurrences of warm and cold events (loosely) since the 2000-01 boreal winter. Also, a strong El-Nino may be “looming”.
The MJO dynamical signal has weakened significantly. For the example, the zonal wave number 1 spatial pattern of tropical/subtropical 200mb velocity potential anomalies has broken up into regional structures during the last few days. In addition, many phase space plots involving the first 2 EOFs of a mutivariate MJO index (equatorially averaged OLRA, 850mb and 200mb vector wind anomalies) no longer show a MJO projection. However, there is still significant tropical convective forcing occurring across the Eastern Hemisphere, and this has and will continue to impact the extratropics until further notice.
Coherent modes Hovmollers suggest that the recent intensification of convection across the west central Pacific may have been linked to a convectively coupled Kelvin wave. Meanwhile, these same plots still show a MJO projection across the northern subtropics centered ~10N/100E per full disk satellite imagery. In fact, a back of the envelope phase speed calculation gives me an eastward propagation of ~4m/s since early this month. Whatever the case (and to save space), we did get our separation of the tropical forcing as discussed a week ago (with weak tropical cyclones across both the Arabian Sea and Bay of Bengal). My feeling is some the tropical forcing centered ~10N/100E will shift generally eastward into the exceptionally warm Tropical Northwest Pacific (TNWP) including the SCS, while convection still remains active possibly as far west as India and the Bay of Bengal (above climatology). I think a component moving into the TNWP is reasonable given there have been ~30-day periods of suppression then enhancement of west Pacific Ocean tropical convection going back to January 2007 linked to extratropical variations.
Restating, from an atmospherics dynamics viewpoint I think the Eastern Hemisphere monsoon systems have become well established, particularly the South Asian system. Animations of daily mean 150mb vector wind anomalies show well developed twin tropical anticyclones from Africa into the Indian Ocean having recent weekly mean anomalies in excess of 20m/s across the Southern Hemisphere (per FNL data). The Webster-Yang index (which also considers the Somalia Jet) shows recent negative vertical wind shear of ~25m/s supporting this observation. The point is the recent intense Indian Ocean tropical forcing (which I can also trace back as a westward shift from central Pacific Ocean forcing starting in January 2007) has fed back to the atmosphere and I think the atmosphere will feedback with additional convection in that region in spite of cooler SSTs. My suspicion is there may be a relatively stationary signal of tropical forcing centered ~10-15N/120-140E starting ~week 2 and continuing through the rest of this summer. Of course, an equally valid option is the 2 regions discussed last week, meaning there is still huge uncertainly. Again, whatever the details it appears probable the Eastern Hemisphere will “call the shots” the rest of this summer, and is one of our reasons for a tilt toward weak La-Nina conditions.
Animations of upper tropospheric daily mean wind fields also present an emerging signal of anomalous twin tropical/subtropical anticyclones ~120E. This is a fundamental change from a week ago where cyclones were present. I think this change is the result of the eastward propagation of the convection north of the equator discussed above. Rossby wave energy dispersions from the extratropics have maintained anomalous upper tropospheric Western Hemisphere equatorial westerly wind flow with weekly means ~25-30m/s west of South America. Tied to this westerly flow are subtropical cyclones just east of the date line and even across the western Atlantic. The AAM tendency zonal mean anomaly plot as well as time-latitude sections of 200mb zonal mean zonal wind anomalies show this anomalous westerly flow is propagating into the subtropical atmospheres, especially the Southern Hemisphere. As I type a summertime version of the East Asia Jet is expanding into the North Pacific as a response.
So, where is the atmosphere going? For the past couple of weeks I have maintained there would be an evolution to GSDM Stage 2 leading to a cool/wet regime focused on the central USA. As of ~18 June, per Global Wind Oscillation (GWO) phase space and R1 global AAM tendency plots, GSDM Stage 2 represented the weather-climate situation. Tied to the very strong subtropical westerly flow discussed above and extratropical Rossby wave energy dispersions linking both the recent Indian Ocean forcing to the anticyclonically wave breaking subtropical central Pacific lows, the PNA trough-ridge-trough pattern I expected set up is going to be about 20-30 degrees of longitude farther east. These same Rossby wave energy dispersions led to the current negative phase of the NAO and recent anomalous ridges across the North Atlantic Ocean. The model forecasts of ridge conditions across the Rockies a couple of weeks ago were correct; however, there has been a catch-up game to the magnitude of the amplitude tied to the dynamics discussed above. A cooler and wetter situation is becoming established across the central states but for a somewhat different synoptic evolution than I advertised a week ago. This serves as another example where this type of predictive information must be expressed probabilistically since synoptic details and timing are white noise after about 5 days (as is the prediction of tropical convection by the models).
As of the 20 June the GWO phase space plot (5-day average) has started an orbit back toward GSDM Stage 1. The global AAM tendency on 22 June was barely positive since (in addition to other terms) both the global mountain and frictional torques started to decrease. The former has a contribution from lowering mean sea-level pressures (MSLP) across East Asia while the latter is from the trades gradually weakening. Global AAM is still ~1 standard deviation below the R1 climatology, and the frictional torque itself remains well above average (~15 Hadleys). Linked to the Eastern Hemisphere tropical forcing I suspect MSLP anomalies across East Asia may become strongly negative during the next week helping to drive down the global mountain torque to well below normal. This may be part of the ~40 day variations of the global mountain torque discussed in past postings. This will drive AAM tendency downward and may force the GWO close to Stage 4 (if this has not already happened). Overall, orbits (magnitudes unclear) around GSDM Stage 1 may be story the rest of this summer.
What this means to me is there should be a relaxation of the anomalous Western Hemisphere equatorial and subtropical upper tropospheric westerly wind flow. It is not unreasonable to expect anomalous zonal mean easterly flow developing throughout the tropics during the next few weeks. Finally, the East Asian Jet (for this time of year) should retract allowing the USA trough-ridge-trough pattern to retrograde after week 1. Interestingly, this notion is consistent with the statement posted in my 22 June discussion, “However, a more probable offering would suggest circulation anomalies to then consolidate leading to a ridge west of North America and a trough across the central part of the USA by week 3.” More ensemble members are starting to suggest this possibility. It would not surprise me to see enough retrogression to allow even an anomalous trough (well against climatology) across the western USA ~weeks 3-4 for a period of time should the Eastern Hemisphere tropical forcing remain stationary and very intense.
International weather ramifications suggest little change for those portions of India into Southeast Asia and China recently ravaged by severe thunderstorms and flooding rainfall for at least the next 1-2 weeks. Tropical cyclones may become a concern weeks 2-4 for the TNWP, and I cannot rule out another Bay of Bengal “surprise”. Convectively coupled Kelvin waves may enhance convection along the East Pacific ITCZ by week 2 while the tropical Atlantic remains “quiet” weeks 1-2.
The generally warm/dry west-southeast and cool/wet south central-northeast USA situation looks intact week 1. I think we will see the ridge amplify closer to the west coast week 2 and possibly back into the East Pacific ~140W weeks 3-4. Whatever the details, I feel confident this regime is retrogressive. During weeks 2-3 intense/severe summertime MCS activity with flooding rainfall may become an issue throughout much of the central USA along with the anomalously cool conditions. Most of the Far West is likely to stay “very hot” and dry through much of week 2, with maybe some relief weeks 3-4 should a trough set up for a period of time. Portions of the Deep South are probable to have above normal summertime heat with relatively suppressed diurnal thunderstorm activity.
Appendix
An experimental phase space plot of the GSDM (which we call a Global Wind Oscillation (GWO)) utilizing normalized relative AAM time tendency (Y-axis) and normalized relative AAM (X-axis) can be found at
http://www.cdc.noaa.gov/map/images/gcm/gsdm_95d.jpg
These are probabilistic statements, and work is ongoing to quantify in future posts. We hope that an opportunity will arise for us to have a dedicated web page effort to expedite more objectively. The WB (2007) paper on the GSDM has been published in the February issue of MWR. I will try to post another discussion this Friday.
Ed Berry
Friday, June 22, 2007
Now Comes the Details and Timing, with lots of Stress and Uncertainty
There is not a significant amount of new information (which does not preclude daily monitoring) I can add today from my posting last Tuesday (19 June), and I will attempt to keep this discussion short. The spatial distribution of global tropical SSTs remains similar to earlier this week and the most intense tropical convective forcing is across the Eastern Hemisphere centered ~10N/110E.
We have a slowly evolving weather-climate situation. A development that I have been monitoring during the week is a possible separation of the Eastern Hemisphere tropical forcing, into perhaps stationary and propagating components. From various monitoring tools including full disk satellite imagery, Hovmoller plots of OLR and their anomalies, animations of upper tropospheric winds, etc., very intense tropical rainfall remains across much of the Arabian Sea into the Bay of Bengal (BB). In fact, a weak tropical cyclone did develop (in spite of high vertical wind shear) across the BB during the week and the remnants are now over India. Meanwhile, there has been eastward propagation north of the equator (~3-4 m/s) projecting onto a MJO which is currently beginning to excite convection from the warm west central into the Tropical Northwest Pacific (TNWP). I am concerned that our old situation (since 2002) of 2 regions of Eastern Hemisphere tropical convective forcing may return during the next few weeks. Any circulation response to this possibility will be complicated. The history has been a GSDM Stage 4-1 behavior, and that is consistent dynamically when the Indian Ocean forcing dominates. Stay tuned.
Upper tropospheric Western Hemisphere equatorial westerly wind anomalies remain well above average having magnitudes ~30m/s at 150mb just west of South America while at 250mb zonal mean anomalies are ~ plus 5m/s (as of 21 June per operational data (FNL)). I can see some evidence from the animations that this anomalous upper tropospheric westerly wind flow is interacting with extratropical Rossby wave trains of both hemispheres, particularly the Southern Hemisphere. This may be the start of the process of poleward and downward propagation, and may eventually (~weeks 1-4) lead to an intensification of the North Pacific Jet (for this time of year). In fact, Rossby wave energy dispersions interacting with the renewed Eastern Hemisphere tropical forcing has led to the recent negative phase of the NAO. Meanwhile the trades have become quite strong from the west central into the eastern Pacific Ocean with anomalies ~5-10m/s around the equatorial date line. The latter is largely a response to the convection to the west. Yes, if the tropical convective forcing remains well entrenched across the Eastern Hemisphere that would help persist these strong trades perhaps reinvigorating La-Nina development. Again, stay tuned.
Global relative AAM tendency per R1 data was ~plus 25 Hadleys 19 June with contributions coming from a strong positive global frictional torque of ~20 Haldeys and an increasing positive global mountain torque (see ESRL/PSD plots for details). Actual global AAM is still more than 1 standard deviation below the 1968-1997 R1 climatology. I think there is a transition from GSDM Stage 1 to Stage 2 going on as I type, and (when updated) the Global Wind Oscillation (GWO) should present a nice orbit in phase space toward this stage.
Huge uncertainty exists on the details how the circulation across the PNA will get to the state discussed on 19 June leading to the central USA cool/wet regime weeks 2-3. Upper tropospheric animations of daily mean vector wind anomalies through 21 June show stationary twin subtropical anticyclones ~40-60E (for at least the last 7-10 days) tied to the Indian Ocean convection with twin cyclones downstream, and another “anticyclone-cyclone couplet” from ~140E to just east of the date line. The latter is tied to the MJO. Even with a possible stationary Indian Ocean signal, I am holding my thought of intense tropical convective forcing across the west central and TNWP leading to the most probable PNA circulation response to GSDM Stage 2 by week 2 (as discussed 19 June). How long this situation persists afterwards is now unclear to me.
As part of catching up, I can see how the models arrive at their solution of an anomalously strong trough “slamming” the USA west coast by late next week. In reality, there may be a stronger North Pacific Jet tied to this trough than shown by the models by the start of week 2, and a split flow situation may develop across west and central North America for a few days. Who knows, might we bypass GSDM Stage 2 and go directly into Stage 3??? However, a more probable offering would suggest circulation anomalies to then consolidate leading to a ridge west of North America and a trough across the central part of the USA by week 3. Thus, still stated with relatively high confidence, my outlook for anomalously cool/wet across the central part of the country for ~weeks 2-3 remains unchanged. Other weather concerns were discussed on the 19 June posting.
Appendix
An experimental phase space plot of the GSDM (which we call a Global Wind Oscillation (GWO)) utilizing normalized relative AAM time tendency (Y-axis) and normalized relative AAM (X-axis) can be found at
http://www.cdc.noaa.gov/map/images/gcm/gsdm_95d.jpg
These are probabilistic statements, and work is ongoing to quantify in future posts. We hope that an opportunity will arise for us to have a dedicated web page effort to expedite more objectively. The WB (2007) paper on the GSDM has been published in the February issue of MWR. I will try to post another discussion early next week.
Ed Berry
We have a slowly evolving weather-climate situation. A development that I have been monitoring during the week is a possible separation of the Eastern Hemisphere tropical forcing, into perhaps stationary and propagating components. From various monitoring tools including full disk satellite imagery, Hovmoller plots of OLR and their anomalies, animations of upper tropospheric winds, etc., very intense tropical rainfall remains across much of the Arabian Sea into the Bay of Bengal (BB). In fact, a weak tropical cyclone did develop (in spite of high vertical wind shear) across the BB during the week and the remnants are now over India. Meanwhile, there has been eastward propagation north of the equator (~3-4 m/s) projecting onto a MJO which is currently beginning to excite convection from the warm west central into the Tropical Northwest Pacific (TNWP). I am concerned that our old situation (since 2002) of 2 regions of Eastern Hemisphere tropical convective forcing may return during the next few weeks. Any circulation response to this possibility will be complicated. The history has been a GSDM Stage 4-1 behavior, and that is consistent dynamically when the Indian Ocean forcing dominates. Stay tuned.
Upper tropospheric Western Hemisphere equatorial westerly wind anomalies remain well above average having magnitudes ~30m/s at 150mb just west of South America while at 250mb zonal mean anomalies are ~ plus 5m/s (as of 21 June per operational data (FNL)). I can see some evidence from the animations that this anomalous upper tropospheric westerly wind flow is interacting with extratropical Rossby wave trains of both hemispheres, particularly the Southern Hemisphere. This may be the start of the process of poleward and downward propagation, and may eventually (~weeks 1-4) lead to an intensification of the North Pacific Jet (for this time of year). In fact, Rossby wave energy dispersions interacting with the renewed Eastern Hemisphere tropical forcing has led to the recent negative phase of the NAO. Meanwhile the trades have become quite strong from the west central into the eastern Pacific Ocean with anomalies ~5-10m/s around the equatorial date line. The latter is largely a response to the convection to the west. Yes, if the tropical convective forcing remains well entrenched across the Eastern Hemisphere that would help persist these strong trades perhaps reinvigorating La-Nina development. Again, stay tuned.
Global relative AAM tendency per R1 data was ~plus 25 Hadleys 19 June with contributions coming from a strong positive global frictional torque of ~20 Haldeys and an increasing positive global mountain torque (see ESRL/PSD plots for details). Actual global AAM is still more than 1 standard deviation below the 1968-1997 R1 climatology. I think there is a transition from GSDM Stage 1 to Stage 2 going on as I type, and (when updated) the Global Wind Oscillation (GWO) should present a nice orbit in phase space toward this stage.
Huge uncertainty exists on the details how the circulation across the PNA will get to the state discussed on 19 June leading to the central USA cool/wet regime weeks 2-3. Upper tropospheric animations of daily mean vector wind anomalies through 21 June show stationary twin subtropical anticyclones ~40-60E (for at least the last 7-10 days) tied to the Indian Ocean convection with twin cyclones downstream, and another “anticyclone-cyclone couplet” from ~140E to just east of the date line. The latter is tied to the MJO. Even with a possible stationary Indian Ocean signal, I am holding my thought of intense tropical convective forcing across the west central and TNWP leading to the most probable PNA circulation response to GSDM Stage 2 by week 2 (as discussed 19 June). How long this situation persists afterwards is now unclear to me.
As part of catching up, I can see how the models arrive at their solution of an anomalously strong trough “slamming” the USA west coast by late next week. In reality, there may be a stronger North Pacific Jet tied to this trough than shown by the models by the start of week 2, and a split flow situation may develop across west and central North America for a few days. Who knows, might we bypass GSDM Stage 2 and go directly into Stage 3??? However, a more probable offering would suggest circulation anomalies to then consolidate leading to a ridge west of North America and a trough across the central part of the USA by week 3. Thus, still stated with relatively high confidence, my outlook for anomalously cool/wet across the central part of the country for ~weeks 2-3 remains unchanged. Other weather concerns were discussed on the 19 June posting.
Appendix
An experimental phase space plot of the GSDM (which we call a Global Wind Oscillation (GWO)) utilizing normalized relative AAM time tendency (Y-axis) and normalized relative AAM (X-axis) can be found at
http://www.cdc.noaa.gov/map/images/gcm/gsdm_95d.jpg
These are probabilistic statements, and work is ongoing to quantify in future posts. We hope that an opportunity will arise for us to have a dedicated web page effort to expedite more objectively. The WB (2007) paper on the GSDM has been published in the February issue of MWR. I will try to post another discussion early next week.
Ed Berry
Tuesday, June 19, 2007
GSDM Stage 2 Coming – Summertime Version
Global tropical SSTs remain above average from the Bay of Bengal to the South China Sea on into the west central Pacific Ocean. As of 18 June per CPC, daily mean anomalies were ~.5-1.5C with totals over 30C along the equatorial west central Pacific and particularly the South China Sea. A horseshoe pattern of positive SSTAs still persists from the west central Pacific into the subtropics of both hemispheres. Recent intense convective rainfall has brought the SSTs close to normal across much of the equatorial Indian Ocean and Arabian Sea. Only weak cool anomalies remain along the equatorial Pacific cold tongue east of 120W (subsurface anomalies are relatively incoherent) while the SSTs are near climatology over the tropical Atlantic.
Development of La-Nina remains highly uncertain. In fact, similar to the boreal summer of 2004 and even nearly a year ago, the possibility exists of a surface westerly wind event on the equator across the west and central Pacific should the MJO (discussed below) come out into that region. Given the observed slow motion of the MJO so far (~2.5-3m/s phase speed from ~2-16 June), there could even be a robust downwelling oceanic Kelvin wave.
Full disk satellite imagery presents a very impressive signal of intense tropical convection across the Eastern Hemisphere, extending east-southeast from the eastern Arabian Sea into much of Indonesia. OLR anomalies have been at least ~minus 50-90 W/m**2 across this region for the past week. Numerous monitoring tools including the Wheeler phase space plot, the Global Wind Oscillation phase plot “derived” from the GSDM (see Appendix), coherent modes Hovmollers and AAM plots indicate this region of tropical forcing is at least a moderate MJO. The notion of a MJO developing across the Eastern Hemisphere was discussed on the 28 May posting. However, it took about 2 weeks longer to become coherent than what I thought at that time (not meaning I was "wrong" for 2 weeks since the notion was stated probabilistically).
This is the first MJO of this magnitude since the December 2006-January 2007 time period. There was a weaker MJO during much of February while 2 other coherent eastward shifts of tropical forcing occurred during approximately late March and late April. The latter were linked with extratropical variations including mountain-frictional torque index cycles (see past postings) which are captured by the GSDM (and Global Wind Oscillation) but not by “conventional MJO tools”.
As of this writing the core of the MJO is at ~5-10N/100E, and has shifted east-northeast of roughly 5 deg of latitude and 30 deg of longitude during the last week. Along the equator this means an increase of phase speed to ~5 m/s in contrast to the slower movement discussed above. The point is the speed of the eastward (along with the northward component) movement is increasing, which is typical for a MJO as it propagates across the Maritime Continent. Tropical thunderstorm clusters are becoming more numerous across the west central and northwest Pacific, while generally suppressed conditions exist across the Western Hemisphere.
The global circulation is responding to the MJO (understanding interactions with the extratropics and subsequent feedbacks). Animations of daily mean 150mb and 250mb vector wind anomalies show well defined but somewhat distorted twin upper tropospheric subtropical anticyclones ~60-90E with downstream cyclones ~120E and just east of the date line. This complex spatial pattern in some sense is a residual of past subseasonal variations now interacting with the MJO as well as wavelength differences due to austral winter and boreal summer.
Daily mean 150mb vector wind anomalies are at least 10-20m/s and even exceeding 40m/s with the subtropical cyclones ~120E. Strong upper tropospheric divergence is not only seen in the anomaly fields, but also in the totals. In fact, the 150mb daily mean vector wind total field from 18 June showed strong subtropical anticyclones ~90E supporting an intense Tropical Easterly Jet (TEJ) across equatorial Africa with wind speeds ~of at least 40m/s. Rossby wave energy dispersions from the extratropics of both hemispheres interacting with the MJO during the past 7-10 days have led to strong anticyclonic wave breaking across the deep tropics east of the date line. This wave breaking has allowed for a rapid increase of upper tropospheric westerly flow along the equator across the Western Hemisphere, with 150mb wind speed anomalies ~40m/s at 125W. This has contributed to an increase of zonal mean anomalous westerly wind flow approaching 10m/s at 200mb.
As shown by the Global Wind Oscillation as of 13 June and the R1 AAM plots through 16 June as well as the above discussion, the weather-climate situation is in GSDM Stage 1. Per R1 data global relative AAM remains at least minus 1.5 standard deviations below the 1968-1997 climatology due to anomalous zonal mean subtropical easterly wind flow flanking the equatorial zonal mean westerly flow mentioned above. There are also anomalous zonal mean easterly winds across mid-higher latitudes of both hemispheres flanking strong midlatitude westerlies (see plots). Again, we have a very complicated meridional but somewhat symmetrical distribution of zonal mean zonal wind anomalies tied to subseasonal behaviors for at least the past couple of months.
The signal from the time tendency of global AAM as well as the torques and transports is still fairly weak. However, as of 16 June global AAM tendency has increased to ~plus 10 Hadleys while the global frictional torque is ~plus 20 Hadleys. The increase in the frictional torque has not only come from the strong trades currently moving into the Western Hemisphere, but also from the extratropics. In any case, I do expect AAM tendency to become strongly positive during the next week-10 days and the Global Wind Oscillation to do a large orbit to GSDM Stage 2 by that time.
Specifically, I am expecting the MJO to continue propagating east-northeast into the Tropical Northwest Pacific (TNWP) by the end of week 2 into week 3. It is probable the most intense tropical rainfall will extend from Southeast Asia and China across the Philippines into the west central Pacific. It is unclear to me what will happen afterwards. However, I would expect a signal to propagate into the Western Hemisphere weeks 3-4 while perhaps a stationary component hangs around the TNWP given the exceptionally warm SSTs there. Hence it is probable for the global circulation to be in GSDM Stage 2 by late week 2 and/or week 3. GSDM Stage 3 as part of a large orbit in Global Wind Oscillation phase space (similar to the past 2 in terms of amplitude) afterwards is certainly an option.
International weather ramifications include not only a slight possibility of Bay of Bengal tropical cyclogenesis by week 2 (against climatology), but also a continuation of severe thunderstorms and rainfall across areas already hit hard across Southeast Asia (per WMO). In addition, there will be a growing typhoon hazard across TNWP week 2 and beyond (and perhaps “eventually” the tropical East Pacific). The upper tropospheric Western Hemisphere anomalous equatorial westerly wind flow discussed above not only increases the probability of precipitation suppression across the tropical North Atlantic, but also decreases the probability of tropical cyclone formation in that region. Understanding all options, it will be interesting to see how this situation works out for the 2007 Atlantic Hurricane Season.
For the USA, GSDM Stage 2 suggests anomalous ridge amplification from just off the west coast into northwest Canada and Alaska (~125-140W) with a downstream trough ~100W and a ridge across the Deep Southeast and Florida. Up until 2 days ago, nearly all week-2 ensemble means from various global weather centers were predicting ridge conditions across the western and central USA with the phasing of anomalies nearly opposite to what I am suggesting. More recent runs are now trending toward a more probable solution such as mentioned above which is derived from a detailed diagnostic understanding of the weather-climate system.
Weather ramifications would be anomalous cold/wet focusing on the Plains with warm/dry conditions along the west coast and Deep Southeast, starting during week 2 (the models should do “okay” through ~days 5-7). These temperature and precipitation anomalies would be loosely similar to that observed during the summer of 2004. In fact, there are other tools incorporating the recent anomalously high soil moisture content across portions of the Plains which also support this notion for at least July. However, short story is soil moisture feedbacks are only secondary since any final outcome of temperature and precipitation anomalies primarily comes from the dynamical forcing onto the atmosphere. It is an option for GSDM Stage 2 not only to persist through July, but also into boreal fall.
Appendix
An experimental phase space plot of the GSDM (which we call a Global Wind Oscillation) utilizing normalized relative AAM time tendency (Y-axis) and normalized relative AAM (X-axis) can be found at
http://www.cdc.noaa.gov/map/images/gcm/gsdm_95d.jpg
These are probabilistic statements, and work is ongoing to quantify in future posts. We hope that an opportunity will arise for us to have a dedicated web page effort to expedite more objectivity. The WB (2007) paper on the GSDM has been published in the February issue of MWR. I will try to do another posting this Friday.
Ed Berry
Development of La-Nina remains highly uncertain. In fact, similar to the boreal summer of 2004 and even nearly a year ago, the possibility exists of a surface westerly wind event on the equator across the west and central Pacific should the MJO (discussed below) come out into that region. Given the observed slow motion of the MJO so far (~2.5-3m/s phase speed from ~2-16 June), there could even be a robust downwelling oceanic Kelvin wave.
Full disk satellite imagery presents a very impressive signal of intense tropical convection across the Eastern Hemisphere, extending east-southeast from the eastern Arabian Sea into much of Indonesia. OLR anomalies have been at least ~minus 50-90 W/m**2 across this region for the past week. Numerous monitoring tools including the Wheeler phase space plot, the Global Wind Oscillation phase plot “derived” from the GSDM (see Appendix), coherent modes Hovmollers and AAM plots indicate this region of tropical forcing is at least a moderate MJO. The notion of a MJO developing across the Eastern Hemisphere was discussed on the 28 May posting. However, it took about 2 weeks longer to become coherent than what I thought at that time (not meaning I was "wrong" for 2 weeks since the notion was stated probabilistically).
This is the first MJO of this magnitude since the December 2006-January 2007 time period. There was a weaker MJO during much of February while 2 other coherent eastward shifts of tropical forcing occurred during approximately late March and late April. The latter were linked with extratropical variations including mountain-frictional torque index cycles (see past postings) which are captured by the GSDM (and Global Wind Oscillation) but not by “conventional MJO tools”.
As of this writing the core of the MJO is at ~5-10N/100E, and has shifted east-northeast of roughly 5 deg of latitude and 30 deg of longitude during the last week. Along the equator this means an increase of phase speed to ~5 m/s in contrast to the slower movement discussed above. The point is the speed of the eastward (along with the northward component) movement is increasing, which is typical for a MJO as it propagates across the Maritime Continent. Tropical thunderstorm clusters are becoming more numerous across the west central and northwest Pacific, while generally suppressed conditions exist across the Western Hemisphere.
The global circulation is responding to the MJO (understanding interactions with the extratropics and subsequent feedbacks). Animations of daily mean 150mb and 250mb vector wind anomalies show well defined but somewhat distorted twin upper tropospheric subtropical anticyclones ~60-90E with downstream cyclones ~120E and just east of the date line. This complex spatial pattern in some sense is a residual of past subseasonal variations now interacting with the MJO as well as wavelength differences due to austral winter and boreal summer.
Daily mean 150mb vector wind anomalies are at least 10-20m/s and even exceeding 40m/s with the subtropical cyclones ~120E. Strong upper tropospheric divergence is not only seen in the anomaly fields, but also in the totals. In fact, the 150mb daily mean vector wind total field from 18 June showed strong subtropical anticyclones ~90E supporting an intense Tropical Easterly Jet (TEJ) across equatorial Africa with wind speeds ~of at least 40m/s. Rossby wave energy dispersions from the extratropics of both hemispheres interacting with the MJO during the past 7-10 days have led to strong anticyclonic wave breaking across the deep tropics east of the date line. This wave breaking has allowed for a rapid increase of upper tropospheric westerly flow along the equator across the Western Hemisphere, with 150mb wind speed anomalies ~40m/s at 125W. This has contributed to an increase of zonal mean anomalous westerly wind flow approaching 10m/s at 200mb.
As shown by the Global Wind Oscillation as of 13 June and the R1 AAM plots through 16 June as well as the above discussion, the weather-climate situation is in GSDM Stage 1. Per R1 data global relative AAM remains at least minus 1.5 standard deviations below the 1968-1997 climatology due to anomalous zonal mean subtropical easterly wind flow flanking the equatorial zonal mean westerly flow mentioned above. There are also anomalous zonal mean easterly winds across mid-higher latitudes of both hemispheres flanking strong midlatitude westerlies (see plots). Again, we have a very complicated meridional but somewhat symmetrical distribution of zonal mean zonal wind anomalies tied to subseasonal behaviors for at least the past couple of months.
The signal from the time tendency of global AAM as well as the torques and transports is still fairly weak. However, as of 16 June global AAM tendency has increased to ~plus 10 Hadleys while the global frictional torque is ~plus 20 Hadleys. The increase in the frictional torque has not only come from the strong trades currently moving into the Western Hemisphere, but also from the extratropics. In any case, I do expect AAM tendency to become strongly positive during the next week-10 days and the Global Wind Oscillation to do a large orbit to GSDM Stage 2 by that time.
Specifically, I am expecting the MJO to continue propagating east-northeast into the Tropical Northwest Pacific (TNWP) by the end of week 2 into week 3. It is probable the most intense tropical rainfall will extend from Southeast Asia and China across the Philippines into the west central Pacific. It is unclear to me what will happen afterwards. However, I would expect a signal to propagate into the Western Hemisphere weeks 3-4 while perhaps a stationary component hangs around the TNWP given the exceptionally warm SSTs there. Hence it is probable for the global circulation to be in GSDM Stage 2 by late week 2 and/or week 3. GSDM Stage 3 as part of a large orbit in Global Wind Oscillation phase space (similar to the past 2 in terms of amplitude) afterwards is certainly an option.
International weather ramifications include not only a slight possibility of Bay of Bengal tropical cyclogenesis by week 2 (against climatology), but also a continuation of severe thunderstorms and rainfall across areas already hit hard across Southeast Asia (per WMO). In addition, there will be a growing typhoon hazard across TNWP week 2 and beyond (and perhaps “eventually” the tropical East Pacific). The upper tropospheric Western Hemisphere anomalous equatorial westerly wind flow discussed above not only increases the probability of precipitation suppression across the tropical North Atlantic, but also decreases the probability of tropical cyclone formation in that region. Understanding all options, it will be interesting to see how this situation works out for the 2007 Atlantic Hurricane Season.
For the USA, GSDM Stage 2 suggests anomalous ridge amplification from just off the west coast into northwest Canada and Alaska (~125-140W) with a downstream trough ~100W and a ridge across the Deep Southeast and Florida. Up until 2 days ago, nearly all week-2 ensemble means from various global weather centers were predicting ridge conditions across the western and central USA with the phasing of anomalies nearly opposite to what I am suggesting. More recent runs are now trending toward a more probable solution such as mentioned above which is derived from a detailed diagnostic understanding of the weather-climate system.
Weather ramifications would be anomalous cold/wet focusing on the Plains with warm/dry conditions along the west coast and Deep Southeast, starting during week 2 (the models should do “okay” through ~days 5-7). These temperature and precipitation anomalies would be loosely similar to that observed during the summer of 2004. In fact, there are other tools incorporating the recent anomalously high soil moisture content across portions of the Plains which also support this notion for at least July. However, short story is soil moisture feedbacks are only secondary since any final outcome of temperature and precipitation anomalies primarily comes from the dynamical forcing onto the atmosphere. It is an option for GSDM Stage 2 not only to persist through July, but also into boreal fall.
Appendix
An experimental phase space plot of the GSDM (which we call a Global Wind Oscillation) utilizing normalized relative AAM time tendency (Y-axis) and normalized relative AAM (X-axis) can be found at
http://www.cdc.noaa.gov/map/images/gcm/gsdm_95d.jpg
These are probabilistic statements, and work is ongoing to quantify in future posts. We hope that an opportunity will arise for us to have a dedicated web page effort to expedite more objectivity. The WB (2007) paper on the GSDM has been published in the February issue of MWR. I will try to do another posting this Friday.
Ed Berry
Tuesday, June 12, 2007
Stationary?
With the exception of the cool equatorial East Pacific (negative anomalies ~1-2C just west of South America), global tropical SSTs remain generally above normal as of the 11 June 2007 daily mean analysis from CPC. Largest positive anomaly magnitudes of at least ~1-2C were present over the far western Indian Ocean, the South China Sea (SCS), portions of the Caribbean and eastern Atlantic. SST totals of at least 30C remain across the west central Pacific along with a recent appearance across the SCS. A recent trade wind surge across the equatorial date line region has locally cooled the ocean waters. However, positive anomalies extend to at least a depth of 100-150m meaning the west Pacific cooling will be minimal. Development of La-Nina remains unclear, particularly since subsurface anomalies (per TAO data) have warmed considerably during the past couple of months along the east Pacific equatorial cold tongue.
Full disk satellite imagery has shown a significant increase in tropical convection across the Indian Ocean during the last week, centered ~0/80E as of this writing. This large region of enhanced tropical rainfall (OLRA at least ~minus 50W/m**2) extends from east of Africa into western Indonesia as well as portions of the Arabian Sea and India (enhancing the local monsoon system). There is a “fanning out” of “convective debris” as well as intense rainfall into both hemispheres, particularly the Northern Hemisphere. In fact, interacting with Rossby wave energy dispersion dynamics across Asia, an intense frontal band of severe damaging rainfall and thunderstorms has persisted for several days from the northern Bay of Bengal into southeast China on to the east of Taiwan. These type of interactions has been responsible for yet another enhanced North Pacific jet having recent weekly mean wind speed anomalies ~25m/s at 250mb. There is general convective suppression across equatorial Africa and the west central Pacific while weak enhancement remains around the Americas.
So, do we have a MJO? My feeling is we do. Loose phase speed calculations have this area of enhanced convection coherently moving east at ~3.5 m/s (2-3 deg long/day) since the start of this month across the western Indian Ocean. Animations of 150mb and 250mb daily mean vector wind anomalies from ESRL/PSD not only show intensifying twin anticyclones across the Indian Ocean, but also a rapid increase of anomalous equatorial westerly wind flow at 150mb east of the date line. As of 11 June 2007, as part of a cross equatorial flow response to Rossby wave energy dispersion (from both hemispheres) and subsequent anticyclonic wave breaking activity, 150mb westerly wind anomalies were ~30m/s north of the equator at 160W. This is much stronger than observed a week ago. Furthermore, from plots such as 200mb zonal mean zonal wind anomalies, there is weak evidence of easterly anomalies propagating off the equator into the subtropics (strong westerly anomalies still remain ~30N and S) with westerlies replacing them. Finally, there is also evidence from animations of tropical mean sea level pressure anomalies of an upwelling atmospheric Kelvin wave already hitting the Andes Mountains. In fact, the latter has contributed to another strong negative global mountain torque of ~25 Hadleys (AAM tendency ~minus 20 Hadleys) as of 9 June per reanalysis (R1) data. These and other indications from detailed daily monitoring within the GSDM framework as well as statistical information from plots such as the Wheeler index give me plenty of evidence for a MJO.
There are thoughts that since our recent zonal wave number 1 spatial pattern of 200mb velocity potential is now wave number 2 due to a weaker center around the Americas, one should be skeptical about a MJO. The Rossby wave energy dispersion/anticyclonic wave breaking processes only briefly discussed above has also been occurring around the Americas leading to a low latitude trough just west of Mexico. This is a feedback from the extratropics which has led to the enhanced divergence in that region. It is an option this Western Hemisphere signal may persist longer than the MJO time scale.
GSDM Stage 0.5 best describes the current weather-climate situation. In fact, the GWO has orbited back into the Stage 4-1 phase space quadrant as of 9 June. Understanding uncertainty, my thoughts are for the enhanced convection with the MJO to propagate east and northeast during the next few weeks, with the center reaching perhaps ~10-15N/120-130E by the end of week 2. I also think there is a mountain-frictional torque index cycle linked with this MJO, all meaning (sparing more details) that by around the start of week 3 the global weather-climate situation may be in GSDM Stage 2.
Any outlooks for weeks 1-3 must always incorporate diagnostic information from weather-climate monitoring, especially right now. I expect particularly for weeks 2-3 model performance from many international global operational ensemble prediction systems to suffer, perhaps greatly. Given the slowly evolving character of this MJO and subsequent response, feedbacks, etc., the models should have enough initial condition information to do "well" for ~5-7 days.
For the USA, the northwest shifted active pattern from this past spring is probable to continue for at least the next 7-10 days. Afterwards, going into week 3, a fundamental circulation (at least transient) change to a regime across the PNA sector similar to the summers of 2003 and 2004 may occur. This would suggest ridge amplification west of North America into Alaska, possibly linking up with anticyclonic gyres already present across the Arctic (not discussed to save space). An anomalous trough would then be probable~100W with a downstream ridge across Florida and the Caribbean. There is a hint of this type of regime from some week-2 ensemble means, especially the ESRL/PSD. However, what is depicted by these models I think will be farther west and more probable week-3. Of course, timing is always uncertain.
Weather ramifications would be anomalous cold/wet focusing on the Plains with warm/dry along the west coast and Deep Southeast. International ramifications for the period of weeks 2-3 may include an enhanced risk of tropical cyclone activity across the northwest and east Pacific (understand current conditions across the latter) with a reduced chance of tropical cyclone development across the Atlantic. The evolution of this MJO is unclear to me; however, it may stall in the Eastern Hemisphere and loose coherence after week 3. Should a strong dynamical signal from this MJO propagate coherently into the Western Hemisphere, we may see more than just the transient phase space orbits into GSDM Stage 3 like those observed this past spring.
Appendix
An experimental phase space plot of the GSDM utilizing normalized relative AAM time tendency (Y-axis) and normalized relative AAM (X-axis) can be found at
http://www.cdc.noaa.gov/map/images/gcm/gsdm_95d.jpg
These are probabilistic statements, and work is ongoing to quantify in future posts, particularly if an opportunity arises for us to have a dedicated web page effort. The WB (2007) paper on the GSDM has been published in the February issue of MWR. Due to travel it is unlikely I will be able to write another discussion until early next week.
Ed Berry
Full disk satellite imagery has shown a significant increase in tropical convection across the Indian Ocean during the last week, centered ~0/80E as of this writing. This large region of enhanced tropical rainfall (OLRA at least ~minus 50W/m**2) extends from east of Africa into western Indonesia as well as portions of the Arabian Sea and India (enhancing the local monsoon system). There is a “fanning out” of “convective debris” as well as intense rainfall into both hemispheres, particularly the Northern Hemisphere. In fact, interacting with Rossby wave energy dispersion dynamics across Asia, an intense frontal band of severe damaging rainfall and thunderstorms has persisted for several days from the northern Bay of Bengal into southeast China on to the east of Taiwan. These type of interactions has been responsible for yet another enhanced North Pacific jet having recent weekly mean wind speed anomalies ~25m/s at 250mb. There is general convective suppression across equatorial Africa and the west central Pacific while weak enhancement remains around the Americas.
So, do we have a MJO? My feeling is we do. Loose phase speed calculations have this area of enhanced convection coherently moving east at ~3.5 m/s (2-3 deg long/day) since the start of this month across the western Indian Ocean. Animations of 150mb and 250mb daily mean vector wind anomalies from ESRL/PSD not only show intensifying twin anticyclones across the Indian Ocean, but also a rapid increase of anomalous equatorial westerly wind flow at 150mb east of the date line. As of 11 June 2007, as part of a cross equatorial flow response to Rossby wave energy dispersion (from both hemispheres) and subsequent anticyclonic wave breaking activity, 150mb westerly wind anomalies were ~30m/s north of the equator at 160W. This is much stronger than observed a week ago. Furthermore, from plots such as 200mb zonal mean zonal wind anomalies, there is weak evidence of easterly anomalies propagating off the equator into the subtropics (strong westerly anomalies still remain ~30N and S) with westerlies replacing them. Finally, there is also evidence from animations of tropical mean sea level pressure anomalies of an upwelling atmospheric Kelvin wave already hitting the Andes Mountains. In fact, the latter has contributed to another strong negative global mountain torque of ~25 Hadleys (AAM tendency ~minus 20 Hadleys) as of 9 June per reanalysis (R1) data. These and other indications from detailed daily monitoring within the GSDM framework as well as statistical information from plots such as the Wheeler index give me plenty of evidence for a MJO.
There are thoughts that since our recent zonal wave number 1 spatial pattern of 200mb velocity potential is now wave number 2 due to a weaker center around the Americas, one should be skeptical about a MJO. The Rossby wave energy dispersion/anticyclonic wave breaking processes only briefly discussed above has also been occurring around the Americas leading to a low latitude trough just west of Mexico. This is a feedback from the extratropics which has led to the enhanced divergence in that region. It is an option this Western Hemisphere signal may persist longer than the MJO time scale.
GSDM Stage 0.5 best describes the current weather-climate situation. In fact, the GWO has orbited back into the Stage 4-1 phase space quadrant as of 9 June. Understanding uncertainty, my thoughts are for the enhanced convection with the MJO to propagate east and northeast during the next few weeks, with the center reaching perhaps ~10-15N/120-130E by the end of week 2. I also think there is a mountain-frictional torque index cycle linked with this MJO, all meaning (sparing more details) that by around the start of week 3 the global weather-climate situation may be in GSDM Stage 2.
Any outlooks for weeks 1-3 must always incorporate diagnostic information from weather-climate monitoring, especially right now. I expect particularly for weeks 2-3 model performance from many international global operational ensemble prediction systems to suffer, perhaps greatly. Given the slowly evolving character of this MJO and subsequent response, feedbacks, etc., the models should have enough initial condition information to do "well" for ~5-7 days.
For the USA, the northwest shifted active pattern from this past spring is probable to continue for at least the next 7-10 days. Afterwards, going into week 3, a fundamental circulation (at least transient) change to a regime across the PNA sector similar to the summers of 2003 and 2004 may occur. This would suggest ridge amplification west of North America into Alaska, possibly linking up with anticyclonic gyres already present across the Arctic (not discussed to save space). An anomalous trough would then be probable~100W with a downstream ridge across Florida and the Caribbean. There is a hint of this type of regime from some week-2 ensemble means, especially the ESRL/PSD. However, what is depicted by these models I think will be farther west and more probable week-3. Of course, timing is always uncertain.
Weather ramifications would be anomalous cold/wet focusing on the Plains with warm/dry along the west coast and Deep Southeast. International ramifications for the period of weeks 2-3 may include an enhanced risk of tropical cyclone activity across the northwest and east Pacific (understand current conditions across the latter) with a reduced chance of tropical cyclone development across the Atlantic. The evolution of this MJO is unclear to me; however, it may stall in the Eastern Hemisphere and loose coherence after week 3. Should a strong dynamical signal from this MJO propagate coherently into the Western Hemisphere, we may see more than just the transient phase space orbits into GSDM Stage 3 like those observed this past spring.
Appendix
An experimental phase space plot of the GSDM utilizing normalized relative AAM time tendency (Y-axis) and normalized relative AAM (X-axis) can be found at
http://www.cdc.noaa.gov/map/images/gcm/gsdm_95d.jpg
These are probabilistic statements, and work is ongoing to quantify in future posts, particularly if an opportunity arises for us to have a dedicated web page effort. The WB (2007) paper on the GSDM has been published in the February issue of MWR. Due to travel it is unlikely I will be able to write another discussion until early next week.
Ed Berry
Friday, June 08, 2007
Update on a Stalled Atmosphere
Reanalysis-1 (R1) data flow problems into ESRL/PSD have been solved meaning the AAM and GSDM/GWO plots are being reasonably updated .
This posting will be abbreviated due to time constraints. There has not been much change to the global distribution of tropical and subtropical SSTs since 6/4. Weak cool anomalies have developed across portions of the Arabian Sea in the wake of Severe Hurricane (Category 5 on the Saffir-Simpson Scale) Gonu. In fact, even though Gonu may have been the strongest tropical cyclone on record in that region, there was a weak MJO related week-1 signal to predicting the possibility of the occurrence of at least a tropical cyclone in that region. SST anomalies have dropped to at least ~minus 2C west of South America along the Pacific cold tongue (down to ~200m to 160W per TAO data) while some warming has occurred across the equatorial Atlantic. The development of La-Nina remains unclear, especially since the tropical west Pacific Ocean remains above normal (stated scientifically, understanding other discussions on this matter). The recent increase in the trades across that region may lead to respectable cooling there (as a response to the recent Indian Ocean convection).
I think the MJO dynamical signal remains stalled in the region of Africa per several monitoring tools such as OLR and upper tropospheric velocity potential. Tropical convection has been getting better organized ~5N/40-60E during the last few days. Per full disk satellite imagery enhanced rainfall covers much of the Arabian Sea into the Indian Monsoon region (3 day averaged OLRA ~minus 50 W/m**2 per BMRC). There has been suppression from Southeast China into the west Pacific. However, intense clusters of thunderstorms are rapidly developing across the “dangerous” west central and tropical northwest Pacific Ocean. Twin upper tropospheric tropical anticyclones have been intensifying across the Indian Ocean. Additionally, there has been a general increase in upper tropospheric zonal mean anomalous easterly wind flow throughout the deep tropical and subtropical atmospheres over the last few days, particularly north of the equator. Anomalous zonal mean westerly flow remains ~30-35 N and S (~10m/s at 200mb).
The global weather-climate situation remains solidly in GSDM Stage 1. As shown by the GWO phase space plot, there has been a recent small orbit due to the latest mountain/frictional torque index cycle. Interestingly, there has been a drift toward the right side of this plot during the last few months. I speculate contributions to this drift (meaning a slow increase in westerly flow throughout the atmosphere) have come from the mountain/frictional torque index cycles as well as the west Pacific Ocean tropical convection.
It is probable the MJO dynamical signal will drift east and north (typical of boreal summer) during the next few weeks, possibly reaching the warm west and northwest Pacific Ocean during weeks 3-4. It is also probable there will be separate flare-ups across the west Pacific Ocean within our stationary to slowly evolving GSDM Stage 1 atmosphere. This suggests the Indian Monsoon will remain active, while the Indo-China and Southeast Asian regions possibly intensify. Tropical cyclone risks may increase southeast of the Philippines by ~week 3.
More strong western USA troughs with downstream south central-eastern states ridging will continue for at least the next 10 days. Related to the seasonal cycle, perhaps by ~week 3 a trough may become established around the Pacific Northwest supporting intense summertime ridging across particularly the south central/central USA. Many numerical ensemble prediction systems have been suggesting ridge conditions over the Desert Southwest by week 2, attributable as a “pre-monsoon” signal by some. The latter is not a meteorological reason, in terms of the dynamics of subseasonal variability including the behaviors described by GSDM. In fact, I can easily see more strong troughs impacting the Pacific Northwest into the Plains going into July. Weather ramifications for the USA I think are understood.
Appendix
An experimental phase space plot of the GSDM (depicting a global wind oscillation) utilizing normalized relative AAM time tendency (Y-axis) and normalized relative AAM (X-axis) can be found at
http://www.cdc.noaa.gov/map/images/gcm/gsdm_95d.jpg
These are probabilistic statements, and work is ongoing to quantify in future posts. I hope the opportunity will arise soon to have a dedicated web page effort for our work. The WB (2007) paper on the GSDM has been published in the February issue of MWR. I will try to write a discussion early next week.
Ed Berry
This posting will be abbreviated due to time constraints. There has not been much change to the global distribution of tropical and subtropical SSTs since 6/4. Weak cool anomalies have developed across portions of the Arabian Sea in the wake of Severe Hurricane (Category 5 on the Saffir-Simpson Scale) Gonu. In fact, even though Gonu may have been the strongest tropical cyclone on record in that region, there was a weak MJO related week-1 signal to predicting the possibility of the occurrence of at least a tropical cyclone in that region. SST anomalies have dropped to at least ~minus 2C west of South America along the Pacific cold tongue (down to ~200m to 160W per TAO data) while some warming has occurred across the equatorial Atlantic. The development of La-Nina remains unclear, especially since the tropical west Pacific Ocean remains above normal (stated scientifically, understanding other discussions on this matter). The recent increase in the trades across that region may lead to respectable cooling there (as a response to the recent Indian Ocean convection).
I think the MJO dynamical signal remains stalled in the region of Africa per several monitoring tools such as OLR and upper tropospheric velocity potential. Tropical convection has been getting better organized ~5N/40-60E during the last few days. Per full disk satellite imagery enhanced rainfall covers much of the Arabian Sea into the Indian Monsoon region (3 day averaged OLRA ~minus 50 W/m**2 per BMRC). There has been suppression from Southeast China into the west Pacific. However, intense clusters of thunderstorms are rapidly developing across the “dangerous” west central and tropical northwest Pacific Ocean. Twin upper tropospheric tropical anticyclones have been intensifying across the Indian Ocean. Additionally, there has been a general increase in upper tropospheric zonal mean anomalous easterly wind flow throughout the deep tropical and subtropical atmospheres over the last few days, particularly north of the equator. Anomalous zonal mean westerly flow remains ~30-35 N and S (~10m/s at 200mb).
The global weather-climate situation remains solidly in GSDM Stage 1. As shown by the GWO phase space plot, there has been a recent small orbit due to the latest mountain/frictional torque index cycle. Interestingly, there has been a drift toward the right side of this plot during the last few months. I speculate contributions to this drift (meaning a slow increase in westerly flow throughout the atmosphere) have come from the mountain/frictional torque index cycles as well as the west Pacific Ocean tropical convection.
It is probable the MJO dynamical signal will drift east and north (typical of boreal summer) during the next few weeks, possibly reaching the warm west and northwest Pacific Ocean during weeks 3-4. It is also probable there will be separate flare-ups across the west Pacific Ocean within our stationary to slowly evolving GSDM Stage 1 atmosphere. This suggests the Indian Monsoon will remain active, while the Indo-China and Southeast Asian regions possibly intensify. Tropical cyclone risks may increase southeast of the Philippines by ~week 3.
More strong western USA troughs with downstream south central-eastern states ridging will continue for at least the next 10 days. Related to the seasonal cycle, perhaps by ~week 3 a trough may become established around the Pacific Northwest supporting intense summertime ridging across particularly the south central/central USA. Many numerical ensemble prediction systems have been suggesting ridge conditions over the Desert Southwest by week 2, attributable as a “pre-monsoon” signal by some. The latter is not a meteorological reason, in terms of the dynamics of subseasonal variability including the behaviors described by GSDM. In fact, I can easily see more strong troughs impacting the Pacific Northwest into the Plains going into July. Weather ramifications for the USA I think are understood.
Appendix
An experimental phase space plot of the GSDM (depicting a global wind oscillation) utilizing normalized relative AAM time tendency (Y-axis) and normalized relative AAM (X-axis) can be found at
http://www.cdc.noaa.gov/map/images/gcm/gsdm_95d.jpg
These are probabilistic statements, and work is ongoing to quantify in future posts. I hope the opportunity will arise soon to have a dedicated web page effort for our work. The WB (2007) paper on the GSDM has been published in the February issue of MWR. I will try to write a discussion early next week.
Ed Berry
Monday, June 04, 2007
Slowly Evolving and Painfully Non-Trivial (and to write about)
Reanalysis-1 (R1) data is still slow getting to ESRL/PSD meaning the AAM plots and GWO phase space diagram do not have the most recent information.
Global tropical SSTs remain generally above normal over the Eastern Hemisphere and portions of the Atlantic Ocean with cool anomalies across the central and eastern equatorial Pacific cold tongue. Magnitudes are ~0.5-1C with up to 2C warmth across the Arabian Sea (which supported the development of Severe Hurricane Gonu (Category 5) during the last few days), the southwest Caribbean and around the African coasts, with ~2C coolness just west of South America. The highest SST totals of ~30C are in the region of Indonesia into the west central Pacific north of the equator. SST anomaly tendencies have become negative across the western Indian Ocean due to recent rainfall, and “mixed” along the equatorial Pacific cold tongue due to recent surface westerlies. Upwelling of colder subsurface waters (~minus 2-3C down to 200m around 120-150W per TAO data) will be needed if La-Nina development is to resume.
In my posting last week I stated the MJO tropical convective signal was back. Since then, a convectively coupled Kelvin wave propagated downstream and weakened while strong thunderstorm clusters developed from Africa into the western Indian Ocean. From monitoring the upper tropospheric winds via animations of 150mb and 250mb daily mean vector wind anomalies and various Hovmoller plots, I think the MJO dynamical signal has stalled in the region of Africa. The 200mb velocity potential zonal wave number 1 spatial distribution with the negative center in the region of Africa also supports this notion, as does the Wheeler phase space plot.
Zonal mean easterly wind anomalies (~5m/s at 200mb) remain throughout the deep tropical and subtropical atmospheres flanked by above average westerly flow around 25-30 degrees north and south. There is still the above average zonal mean westerly flow across the higher mid-latitudes of both hemispheres with zonal mean easterlies in between the anomalous westerlies.
Getting into some more detail, anomalously strong twin upper tropospheric subtropical anticyclones remain across the Western Hemisphere (~10-20m/s wind anomalies per recent weekly mean) centered on the Atlantic with weaker pairs developing across Africa into the western Indian Ocean (which may have provided a favorable vertical wind shear profile for the development of Gonu) and ~140E. The latter pair of anticyclones is tied to Rossby wave energy dispersions (RWDs) from the northern and southern extratropics. In fact, there is currently a well defined RWD from the northern 140E subtropical anticylone which hooks up nicely with the trough that is about to dig into the western USA. Associated with twin upper tropospheric subtropical cyclones, westerlies (~5-10m/s at 150mb) have developed across the equatorial eastern Indian and central Pacific Oceans. Overall, there is a zonal wave number 2 (possibly 3) distribution to the circulation features across the tropical and subtropical atmospheres.
Summarizing thus far, I think we have inter-hemispheric symmetry of zonal mean wind anomalies, with the greater response in the Southern Hemisphere (austral winter). Furthermore, various time-longitude sections over different latitiude bands of fields such as 250mb meridional wind anomalies suggest at least a significant slowing of the eastward progressions of synoptic wave trains during the past week. Perhaps tied to the seasonal cycle, we may be evolving into a base state dominated by stationary rather than oscillatory behaviors. In this case, our base state is best described by GSDM Stage 1 with global relative AAM at least 1 standard deviation below the 1979-1998 operational data climatology. I can speculate that what we are currently seeing may be a slow feedback process to subseasonal variations that started back in December 2006.
So where does the atmosphere go from here? The upper tropospheric equatorial westerly flow anomalies across the central Pacific may be a signal that at least some eastward movement of circulation anomalies will occur during the next few weeks. The same should also occur with the tropical convective dynamical signal. My first thought would be to see the convective signal shift well into the Indian Ocean during weeks 2-3. I also have a thought the 140E twin anticyclones may shift into the warm west Pacific Ocean while another pair lingers around 60W. Hence we may see 3 regions of enhanced tropical rainfall by the end of week 2, with the most intense from the Indian Ocean northeast into Indo-China as part of the Eastern Hemisphere monsoon systems. I also have week-2 concerns of an increasing tropical cyclone hazard not only around the Philippines, but also the western Atlantic into the Caribbean.
The North Pacific Rossby wave energy dispersion discussed above I think is yet another 10-30 day rendition of a global mountain-frictional torque index cycle (currently headed toward loosely negative-positive). This variation is contributing to another negative global AAM tendency (inferred from the operational data plot) and the GWO phase space diagram should indicate an orbit toward GSDM Stage 4 when updated. However, in comparison to what was observed during much of April and May, this orbit is likely to be small, remaining around GSDM Stage 1.
As discussed previously in the face of many week-2 ensemble means showing ridge conditions across the western states valid this week, an anomalously strong trough is currently digging into the western USA. Per above, I think this synoptic pattern (with a strong ridge across the southeast states and from the central Pacific into Alaska) will persist for at least the next couple of weeks within our GSDM Stage 1 base state. Most operational models are now supportive. At some point this circulation pattern should shift far enough northwest to “allow summertime” across the lower 48 states (my focus for these discussions).
The weather ramifications of this type of circulation pattern across the USA should be apparent by now. For example, for at least the next 2 weeks the Central and Northern Plains into the Upper Mississippi Valley and at times Ohio Valley are likely to be targeted with several rounds of severe thunderstorms. Additional hazards will be tornadoes and heavy flooding rainfall. Intense summertime heat is probable for the Deep South. Western Atlantic/Caribbean tropical cyclogenesis may become probable weeks 2-3 which could impact the USA.
Appendix
An experimental phase space plot of the GSDM utilizing normalized relative AAM time tendency (Y-axis) and normalized relative AAM (X-axis) can be found at
http://www.cdc.noaa.gov/map/images/gcm/gsdm_95d.jpg
These are probabilistic statements, and work is ongoing to quantify in future posts, particularly if an opportunity arises for us to have a dedicated web page effort. The WB (2007) paper on the GSDM has been published in the February issue of MWR. I plan to issue a discussion this Friday (6/8).
Ed Berry
Global tropical SSTs remain generally above normal over the Eastern Hemisphere and portions of the Atlantic Ocean with cool anomalies across the central and eastern equatorial Pacific cold tongue. Magnitudes are ~0.5-1C with up to 2C warmth across the Arabian Sea (which supported the development of Severe Hurricane Gonu (Category 5) during the last few days), the southwest Caribbean and around the African coasts, with ~2C coolness just west of South America. The highest SST totals of ~30C are in the region of Indonesia into the west central Pacific north of the equator. SST anomaly tendencies have become negative across the western Indian Ocean due to recent rainfall, and “mixed” along the equatorial Pacific cold tongue due to recent surface westerlies. Upwelling of colder subsurface waters (~minus 2-3C down to 200m around 120-150W per TAO data) will be needed if La-Nina development is to resume.
In my posting last week I stated the MJO tropical convective signal was back. Since then, a convectively coupled Kelvin wave propagated downstream and weakened while strong thunderstorm clusters developed from Africa into the western Indian Ocean. From monitoring the upper tropospheric winds via animations of 150mb and 250mb daily mean vector wind anomalies and various Hovmoller plots, I think the MJO dynamical signal has stalled in the region of Africa. The 200mb velocity potential zonal wave number 1 spatial distribution with the negative center in the region of Africa also supports this notion, as does the Wheeler phase space plot.
Zonal mean easterly wind anomalies (~5m/s at 200mb) remain throughout the deep tropical and subtropical atmospheres flanked by above average westerly flow around 25-30 degrees north and south. There is still the above average zonal mean westerly flow across the higher mid-latitudes of both hemispheres with zonal mean easterlies in between the anomalous westerlies.
Getting into some more detail, anomalously strong twin upper tropospheric subtropical anticyclones remain across the Western Hemisphere (~10-20m/s wind anomalies per recent weekly mean) centered on the Atlantic with weaker pairs developing across Africa into the western Indian Ocean (which may have provided a favorable vertical wind shear profile for the development of Gonu) and ~140E. The latter pair of anticyclones is tied to Rossby wave energy dispersions (RWDs) from the northern and southern extratropics. In fact, there is currently a well defined RWD from the northern 140E subtropical anticylone which hooks up nicely with the trough that is about to dig into the western USA. Associated with twin upper tropospheric subtropical cyclones, westerlies (~5-10m/s at 150mb) have developed across the equatorial eastern Indian and central Pacific Oceans. Overall, there is a zonal wave number 2 (possibly 3) distribution to the circulation features across the tropical and subtropical atmospheres.
Summarizing thus far, I think we have inter-hemispheric symmetry of zonal mean wind anomalies, with the greater response in the Southern Hemisphere (austral winter). Furthermore, various time-longitude sections over different latitiude bands of fields such as 250mb meridional wind anomalies suggest at least a significant slowing of the eastward progressions of synoptic wave trains during the past week. Perhaps tied to the seasonal cycle, we may be evolving into a base state dominated by stationary rather than oscillatory behaviors. In this case, our base state is best described by GSDM Stage 1 with global relative AAM at least 1 standard deviation below the 1979-1998 operational data climatology. I can speculate that what we are currently seeing may be a slow feedback process to subseasonal variations that started back in December 2006.
So where does the atmosphere go from here? The upper tropospheric equatorial westerly flow anomalies across the central Pacific may be a signal that at least some eastward movement of circulation anomalies will occur during the next few weeks. The same should also occur with the tropical convective dynamical signal. My first thought would be to see the convective signal shift well into the Indian Ocean during weeks 2-3. I also have a thought the 140E twin anticyclones may shift into the warm west Pacific Ocean while another pair lingers around 60W. Hence we may see 3 regions of enhanced tropical rainfall by the end of week 2, with the most intense from the Indian Ocean northeast into Indo-China as part of the Eastern Hemisphere monsoon systems. I also have week-2 concerns of an increasing tropical cyclone hazard not only around the Philippines, but also the western Atlantic into the Caribbean.
The North Pacific Rossby wave energy dispersion discussed above I think is yet another 10-30 day rendition of a global mountain-frictional torque index cycle (currently headed toward loosely negative-positive). This variation is contributing to another negative global AAM tendency (inferred from the operational data plot) and the GWO phase space diagram should indicate an orbit toward GSDM Stage 4 when updated. However, in comparison to what was observed during much of April and May, this orbit is likely to be small, remaining around GSDM Stage 1.
As discussed previously in the face of many week-2 ensemble means showing ridge conditions across the western states valid this week, an anomalously strong trough is currently digging into the western USA. Per above, I think this synoptic pattern (with a strong ridge across the southeast states and from the central Pacific into Alaska) will persist for at least the next couple of weeks within our GSDM Stage 1 base state. Most operational models are now supportive. At some point this circulation pattern should shift far enough northwest to “allow summertime” across the lower 48 states (my focus for these discussions).
The weather ramifications of this type of circulation pattern across the USA should be apparent by now. For example, for at least the next 2 weeks the Central and Northern Plains into the Upper Mississippi Valley and at times Ohio Valley are likely to be targeted with several rounds of severe thunderstorms. Additional hazards will be tornadoes and heavy flooding rainfall. Intense summertime heat is probable for the Deep South. Western Atlantic/Caribbean tropical cyclogenesis may become probable weeks 2-3 which could impact the USA.
Appendix
An experimental phase space plot of the GSDM utilizing normalized relative AAM time tendency (Y-axis) and normalized relative AAM (X-axis) can be found at
http://www.cdc.noaa.gov/map/images/gcm/gsdm_95d.jpg
These are probabilistic statements, and work is ongoing to quantify in future posts, particularly if an opportunity arises for us to have a dedicated web page effort. The WB (2007) paper on the GSDM has been published in the February issue of MWR. I plan to issue a discussion this Friday (6/8).
Ed Berry
Monday, May 28, 2007
MJO: "I am Back!"
ESRL/PSD reanalysis-1 (R1) data plots (including the AAM plots) have updated through May 23rd as of this writing. Hopefully the Global Wind Oscillation (GWO) phase space plot will be soon.
With the exception of eastern Indonesia, tropical SSTs remain generally quite warm across the Eastern Hemisphere. The most exceptional positive SST anomalies are over the western Indian Ocean having magnitudes of ~2C and totals in excess of 30C. The west central Pacific warmth continues to hang around (along with its positive anomaly horseshoe pattern into the extratropics) with magnitudes of ~1C (down to ~200m) and totals ~30C. Weakening cool anomalies are still present along the equatorial cold tongue east of the date line while the tropical Atlantic remains “luke warm”. Recent surface westerly wind anomalies have led to some moderation of the tropical east Pacific negative anomalies. Whether or not the colder subsurface anomalies (~minus 3-4C ~100m/140W per TAO data) can be upwelled along with any further development of La-Nina depends on the subseasonal events to be discussed.
Now comes some of the fun discussing recent subseasonal atmospheric activities. It is unfortunate we have not been afforded the opportunity to have a dedicated web page effort to illustrate with graphics the appropriate level of science discussions like these requires. The latter is only fair to meteorology and the users. There is much additional diagnostic information that can and must be incorporated into any forecast process for ~weeks 1-4. Kindly stated, recent numerical model performance and official week 1 forecast products issued last week for the current trough digging into the western USA is yet another example where weather-climate linkage information within the GSDM framework would have helped. There was a consensus our current western USA trough would be progressive, which is not going to happen. In order to use numerical models intelligently a detailed and disciplined understanding of the weather-climate situation requiring rigorous daily monitoring is a must, no exceptions!!! The issue of expressing these predictions probabilistically for the benefit of the users is also another matter needing far more attention.
During late April and ~May 11th there was a weak then strong positive global mountain-negative frictional torque index cycle. The latter had a global signal of ~plus 40 Hadleys for the mountain torque, which was roughly 45 days after the big event during early April. It is kind of “funny” how the intraseasonal time scale works into this. What all this means is dynamical processes involving the (tilts of the) midlatitude synoptic eddies interacting with global north-south mountain massifs are adding anomalous zonal mean westerly flow to particularly the subtropical atmospheres of both hemispheres. The May 11th variation contributed to a global AAM time tendency of at least plus 40 Hadleys.
So, where am I going here? I have discussed in past postings ~10-30 day variability involving the tropical convective forcing and mountain-frictional torques. These atmospheric variations have been occurring since at least mid February, within a base state generally fluxing (transporting) AAM out of the subtropics into the midlatitudes (GSDM Stage 1). The transports are the largest contributor to the earth-atmosphere AAM budget. Having both the Indian Ocean and west Pacific Ocean tropical convective forcing occurring “at the same time” has loosely supported a GSDM Stage 4-1 base state, but with at times significant orbits in phase space as seen on the GWO plot. Monitoring these orbits has added some additional week-2 predictability (over the models) to the barrage of western USA troughs seen this spring. The dynamics for this are complicated, but this is where thinking in terms of forcing-response-feedbacks with subsequent interactions is needed. I think we have just gone through another large orbit in GWO phase space, with the above contributing to it.
The additional anomalous subtropical westerly flow (~5-10m/s at 200mb) and interactions with the synoptic eddies forced the dynamical tropical convective signal into the Western Hemisphere about a week-10 days ago. Possibly involving the seasonal cycle including the Eastern Hemisphere monsoon systems, I think this dynamical signal has developed into a true Madden-Julian Oscillation (MJO). The Wheeler phase space plot strongly supports this assertion, as do phase speed computations of recent OLRA anomalies (~3.5m/s). Full disk satellite imagery has shown a rapid increase of intense tropical convection across the warm waters of the Indian Ocean, centered ~5N/60E. There is sporadic convection across the west central Pacific while thunderstorm clusters linger across Africa and roughly northern South America.
I think the weather-climate situation is solidly in GSDM Stage 4. Anomalous zonal mean easterly flow of ~5m/s at 200mb has developed throughout the tropical atmosphere. Twin upper tropospheric subtropical anticyclones remain across the Western Hemisphere (linked to the subtropical jet across the southern USA), but are slowly progressing into Africa and the Indian Ocean. As of May 23rd the AAM time tendency was ~minus 30 Hadleys which included a contribution from a negative East Asian mountain torque. The anomalous Rossby wave train tied to that torque was one of my reasons for thinking late last week that a slower and deeper western USA trough was more probable this week.
Besides the upper tropospheric zonal mean zonal wind anomalies across the tropical and subtropical atmospheres, there are also zonal mean anomalous easterlies ~35N and 30S, with anomalous westerlies poleward. In fact, at 60N these westerly anomalies have been recently ~plus 15m/s at 200mb, and there is evidence that some of this westerly flow goes back to poleward propagation off the equator from the strong December 2006 MJO event. In any case, this gives some reason to the recent observed midlatitude split flows.
This writing is already far too long. I think the global weather-climate situation will be in GSDM Stage 1 by week 2 as the MJO moves slowly east. I am still unclear about the timing and intensity of this new MJO; however, I speculate its centroid will be ~100-120E by the end of week 2. A trade wind surge downstream from this MJO may "revive" La-Nina development. Both the Indian and Southeast Asian monsoon regions should be active, while the west Pacific remains a “wild card”, as it has for several years. Models are finally starting to pick up not only on the slower and deeper western USA trough (developing into a closed low) for week 1, but even the much stronger system starting ~ day 10. The week 1 trough will be more of a heavy rainfall producer for the Plains and Mississippi Valley while the week 2 system may result in widespread severe storms across the central part of the country including tornadoes. Other ramifications should be apparent. During weeks 3-4 the situation evolve into GSDM Stage 2.
Appendix
An experimental phase space plot of the GSDM (depicting a Global Wind Oscillation (GWO)) utilizing normalized relative AAM time tendency (Y-axis) and normalized relative AAM (X-axis) can be found at
http://www.cdc.noaa.gov/map/images/gcm/gsdm_95d.jpg
These are probabilistic statements, and work is ongoing to quantify in future posts. The WB (2007) paper on the GSDM has been published in the February issue of MWR. I will not be able to write another posting until next Monday (6/4) due to covering various shifts.
Ed Berry
With the exception of eastern Indonesia, tropical SSTs remain generally quite warm across the Eastern Hemisphere. The most exceptional positive SST anomalies are over the western Indian Ocean having magnitudes of ~2C and totals in excess of 30C. The west central Pacific warmth continues to hang around (along with its positive anomaly horseshoe pattern into the extratropics) with magnitudes of ~1C (down to ~200m) and totals ~30C. Weakening cool anomalies are still present along the equatorial cold tongue east of the date line while the tropical Atlantic remains “luke warm”. Recent surface westerly wind anomalies have led to some moderation of the tropical east Pacific negative anomalies. Whether or not the colder subsurface anomalies (~minus 3-4C ~100m/140W per TAO data) can be upwelled along with any further development of La-Nina depends on the subseasonal events to be discussed.
Now comes some of the fun discussing recent subseasonal atmospheric activities. It is unfortunate we have not been afforded the opportunity to have a dedicated web page effort to illustrate with graphics the appropriate level of science discussions like these requires. The latter is only fair to meteorology and the users. There is much additional diagnostic information that can and must be incorporated into any forecast process for ~weeks 1-4. Kindly stated, recent numerical model performance and official week 1 forecast products issued last week for the current trough digging into the western USA is yet another example where weather-climate linkage information within the GSDM framework would have helped. There was a consensus our current western USA trough would be progressive, which is not going to happen. In order to use numerical models intelligently a detailed and disciplined understanding of the weather-climate situation requiring rigorous daily monitoring is a must, no exceptions!!! The issue of expressing these predictions probabilistically for the benefit of the users is also another matter needing far more attention.
During late April and ~May 11th there was a weak then strong positive global mountain-negative frictional torque index cycle. The latter had a global signal of ~plus 40 Hadleys for the mountain torque, which was roughly 45 days after the big event during early April. It is kind of “funny” how the intraseasonal time scale works into this. What all this means is dynamical processes involving the (tilts of the) midlatitude synoptic eddies interacting with global north-south mountain massifs are adding anomalous zonal mean westerly flow to particularly the subtropical atmospheres of both hemispheres. The May 11th variation contributed to a global AAM time tendency of at least plus 40 Hadleys.
So, where am I going here? I have discussed in past postings ~10-30 day variability involving the tropical convective forcing and mountain-frictional torques. These atmospheric variations have been occurring since at least mid February, within a base state generally fluxing (transporting) AAM out of the subtropics into the midlatitudes (GSDM Stage 1). The transports are the largest contributor to the earth-atmosphere AAM budget. Having both the Indian Ocean and west Pacific Ocean tropical convective forcing occurring “at the same time” has loosely supported a GSDM Stage 4-1 base state, but with at times significant orbits in phase space as seen on the GWO plot. Monitoring these orbits has added some additional week-2 predictability (over the models) to the barrage of western USA troughs seen this spring. The dynamics for this are complicated, but this is where thinking in terms of forcing-response-feedbacks with subsequent interactions is needed. I think we have just gone through another large orbit in GWO phase space, with the above contributing to it.
The additional anomalous subtropical westerly flow (~5-10m/s at 200mb) and interactions with the synoptic eddies forced the dynamical tropical convective signal into the Western Hemisphere about a week-10 days ago. Possibly involving the seasonal cycle including the Eastern Hemisphere monsoon systems, I think this dynamical signal has developed into a true Madden-Julian Oscillation (MJO). The Wheeler phase space plot strongly supports this assertion, as do phase speed computations of recent OLRA anomalies (~3.5m/s). Full disk satellite imagery has shown a rapid increase of intense tropical convection across the warm waters of the Indian Ocean, centered ~5N/60E. There is sporadic convection across the west central Pacific while thunderstorm clusters linger across Africa and roughly northern South America.
I think the weather-climate situation is solidly in GSDM Stage 4. Anomalous zonal mean easterly flow of ~5m/s at 200mb has developed throughout the tropical atmosphere. Twin upper tropospheric subtropical anticyclones remain across the Western Hemisphere (linked to the subtropical jet across the southern USA), but are slowly progressing into Africa and the Indian Ocean. As of May 23rd the AAM time tendency was ~minus 30 Hadleys which included a contribution from a negative East Asian mountain torque. The anomalous Rossby wave train tied to that torque was one of my reasons for thinking late last week that a slower and deeper western USA trough was more probable this week.
Besides the upper tropospheric zonal mean zonal wind anomalies across the tropical and subtropical atmospheres, there are also zonal mean anomalous easterlies ~35N and 30S, with anomalous westerlies poleward. In fact, at 60N these westerly anomalies have been recently ~plus 15m/s at 200mb, and there is evidence that some of this westerly flow goes back to poleward propagation off the equator from the strong December 2006 MJO event. In any case, this gives some reason to the recent observed midlatitude split flows.
This writing is already far too long. I think the global weather-climate situation will be in GSDM Stage 1 by week 2 as the MJO moves slowly east. I am still unclear about the timing and intensity of this new MJO; however, I speculate its centroid will be ~100-120E by the end of week 2. A trade wind surge downstream from this MJO may "revive" La-Nina development. Both the Indian and Southeast Asian monsoon regions should be active, while the west Pacific remains a “wild card”, as it has for several years. Models are finally starting to pick up not only on the slower and deeper western USA trough (developing into a closed low) for week 1, but even the much stronger system starting ~ day 10. The week 1 trough will be more of a heavy rainfall producer for the Plains and Mississippi Valley while the week 2 system may result in widespread severe storms across the central part of the country including tornadoes. Other ramifications should be apparent. During weeks 3-4 the situation evolve into GSDM Stage 2.
Appendix
An experimental phase space plot of the GSDM (depicting a Global Wind Oscillation (GWO)) utilizing normalized relative AAM time tendency (Y-axis) and normalized relative AAM (X-axis) can be found at
http://www.cdc.noaa.gov/map/images/gcm/gsdm_95d.jpg
These are probabilistic statements, and work is ongoing to quantify in future posts. The WB (2007) paper on the GSDM has been published in the February issue of MWR. I will not be able to write another posting until next Monday (6/4) due to covering various shifts.
Ed Berry
Friday, May 25, 2007
Update
Reanalysis-1 (R1) data woes still continue meaning ESRL/PSD AAM plots have not updated since May 11th (as well as the GWO phase space plot). Work on resolving this problem is occurring as I type.
I will not post a discussion today since I had to cover an operational shift. I do plan on issuing a discussion on Monday, 5/28.
However, I did have time to do some monitoring, and there is little change from my thoughts given in the May 22nd Blog discussion. The tropical convective dynamical signal is centered ~0/60W and there is now a zonal wave number 1 spatial pattern to the 200mb velocity potential field. Tropical convective forcing is increasing across the Indian Ocean just south of the equator. By the end of week 2 the dynamical signal should be well into the Eastern Hemisphere supporting strong convection from the warm Indian Ocean perhaps into the Indo-China region (including onset of the Indian Monsoon). Suppression may be prevalent across the west central Pacific. In fact, there may be some truth to what the Wheeler phase space plot is already depicting. A true MJO may be developing, or at least a spatially coherent region of tropical forcing and circulation response.
I think the global weather-climate state is solidly in GSDM Stage 4 given increasing easterly flow across the upper tropospheric tropical/subtropical atmospheres and relative AAM becoming negative (per operational plot). Tied to what may be a negative East Asian mountain torque, a baroclinic wave packet coming off that continent is interacting with a downstream Rossby wave train. A probable solution is a slower and deeper western USA trough early next week and some models are beginning to capture that. During week 2, the strong North Pacific jet shown by most models is likely to be transient as the tropical forcing intensifies across the Eastern Hemisphere. I favor an evolution toward GSDM Stage 1 increasing the probability of yet another unseasonably strong western USA trough by week 3.
Appendix
An experimental phase space plot of the GSDM utilizing normalized relative AAM tendency (Y-axis) and normalized relative AAM (X-axis) can be found at
http://www.cdc.noaa.gov/map/images/gcm/gsdm_95d.jpg
These are probabilistic statements, and work is ongoing to quantify in future posts. The WB (2007) paper on the GSDM has been published in the February issue of MWR. I plan on writing a posting 5/28. Also, since I have to cover additional shifts next week, the posting after that is likely to be the following Monday, 6/4.
Ed Berry
I will not post a discussion today since I had to cover an operational shift. I do plan on issuing a discussion on Monday, 5/28.
However, I did have time to do some monitoring, and there is little change from my thoughts given in the May 22nd Blog discussion. The tropical convective dynamical signal is centered ~0/60W and there is now a zonal wave number 1 spatial pattern to the 200mb velocity potential field. Tropical convective forcing is increasing across the Indian Ocean just south of the equator. By the end of week 2 the dynamical signal should be well into the Eastern Hemisphere supporting strong convection from the warm Indian Ocean perhaps into the Indo-China region (including onset of the Indian Monsoon). Suppression may be prevalent across the west central Pacific. In fact, there may be some truth to what the Wheeler phase space plot is already depicting. A true MJO may be developing, or at least a spatially coherent region of tropical forcing and circulation response.
I think the global weather-climate state is solidly in GSDM Stage 4 given increasing easterly flow across the upper tropospheric tropical/subtropical atmospheres and relative AAM becoming negative (per operational plot). Tied to what may be a negative East Asian mountain torque, a baroclinic wave packet coming off that continent is interacting with a downstream Rossby wave train. A probable solution is a slower and deeper western USA trough early next week and some models are beginning to capture that. During week 2, the strong North Pacific jet shown by most models is likely to be transient as the tropical forcing intensifies across the Eastern Hemisphere. I favor an evolution toward GSDM Stage 1 increasing the probability of yet another unseasonably strong western USA trough by week 3.
Appendix
An experimental phase space plot of the GSDM utilizing normalized relative AAM tendency (Y-axis) and normalized relative AAM (X-axis) can be found at
http://www.cdc.noaa.gov/map/images/gcm/gsdm_95d.jpg
These are probabilistic statements, and work is ongoing to quantify in future posts. The WB (2007) paper on the GSDM has been published in the February issue of MWR. I plan on writing a posting 5/28. Also, since I have to cover additional shifts next week, the posting after that is likely to be the following Monday, 6/4.
Ed Berry
Tuesday, May 22, 2007
Atmosphere Lacks Discipline
Reanalysis-1 (R1) data woes still continue meaning ESRL/PSD AAM plots have not updated since May 11th (as well as the GWO phase space plot).
There has been no significant change to the distribution of global tropical SSTs discussed in my May 18th posting (please review for details). La-Nina development during the next 3-6 months still remains a possibility.
The tropical convective forcing dynamical signal is well into the Western Hemisphere (WH). It is centered ~0/80W and is moving east at around 10m/s or roughly 7-8 deg long/day. Enhanced convection extends from the East Pacific ITCZ all the way into west central Africa. This signal has some projection onto a convectively coupled Kelvin wave. However, it is only a component of strong tropical-extratropical interactions that have occurred during the past few weeks. These interactions included the global mountain-frictional torque index cycle earlier this month within a general envelope of 20-30 day atmospheric variability.
Full disk satellite imagery not only shows the enhanced tropical convection across the WH, but also a loose consolidation of forcing centered ~5-10N/140E. The latter extends from eastern Indonesia into portions of the central Pacific. The Indian Ocean remains suppressed. However, strong enhancement is spreading across equatorial Africa as I type, and the Indian Ocean could become active much sooner than I think given the warm SSTs in that region.
It has been a real struggle trying to monitor these fast modes of tropical/extratropical variability and interactions. There has been no recent MJO signal, and as shown by the GWO phase space plot, our base state has been orbiting around GSDM Stage 1 since mid February. These orbits have come from competing tropical forcing from the East Indian and west Pacific Oceans, as well as mountain-frictional torque index cycles. Interactions with the mid-latitude synoptic eddies have maintained a loose AAM transport signal of fluxing momentum out of the subtropics into the mid-latitudes hence persisting a GSDM Stage 1 base state. Some of the past week 2-3 predictability “successes” for the USA have come from daily monitoring the GWO and AAM transport signals.
Most recently there has been the issue of whether or not an early onset to the Indian Monsoon would occur. In past discussions I have felt that was probable. However, per yearly ESRL/PSD time-latitude sections of OLRA, there was already enhanced convection across the Indian Ocean and portions of India at this time. Currently we have suppression there. My feeling is the current WH dynamical signal will be the catalyst needed to lead to the onset of the Indian Monsoon. Extrapolation would be in ~2 weeks, possibly much sooner given current satellite trends. However, my concerns about the warm west Pacific remain and a resumption of forcing from ~0/80-150E extending into the Southeast Asian monsoon region may occur by ~week 3 instead. Whatever does happen is unclear to me.
Animations of upper tropospheric vector wind anomalies shows twin tropical anticyclones centered ~80W as part of the WH dynamical signal. Even larger twin subtropical anticyclones are present ~150-160E (anomalies ~40m/s at 150mb) directly linked to the west Pacific convection locally forced by the warm SSTs. A strong Rossby wave energy dispersion across the North Pacific from these anticyclones is contributing to the present digging western USA trough. Not only have I struggled with the degree of amplification of this trough, but so have the models.
200mb zonal mean zonal wind anomalies (a good proxy for vertically integrated tropospheric AAM) remain above average throughout both the subtropical (~5m/s) and midlatitude (~10m/s) atmospheres of both hemispheres. Anomalous upper tropospheric subtropical easterly flow is returning to the Eastern Hemisphere and the recent extended North Pacific jet (for this time of year) is collapsing. Just how much easterly flow returns to the tropics and subtropics may have some dependency on the magnitude of the Indian Monsoon. If the west Pacific forcing continues to be an important component to the weather-climate system going into boreal summer, above average zonal mean tropical/subtropical westerly flow may be probable. My own feeling is the latter will have an influence. If so, speculation suggests a possible negative factor for Atlantic tropical cyclone development.
I think the weather-climate system is in a GSDM Stage 3-4 situation. I think Stage 4 is probable by week 2 and then Stage 1 afterwards. However, unlike much this past winter and spring, uncertainty is much higher than average. After an active week 1 for especially the Rockies and Plains, there should be a break by around the middle of next week. I like the solution offered by the ESRL/PSD ensemble suggesting more anomalous troughs particularly across the southwestern states starting ~day 10. Afterwards, a general western states trough and southeast USA ridge pattern is the most probable solution I can offer, especially by week 3. This would target the Northern Plains and Upper Mississippi Valley with rounds of MCS activity including severe storms and heavy rainfall, while intense heat occurs across the Deep South.
Appendix
An experimental phase space plot of the GSDM utilizing normalized relative AAM tendency (Y-axis) and normalized relative AAM (X-axis) can be found at
http://www.cdc.noaa.gov/map/images/gcm/gsdm_95d.jpg
These are probabilistic statements, and work is ongoing to quantify in future posts. The WB (2007) paper on the GSDM has been published in the February issue of MWR. I will try to post an update this Friday.
Ed Berry
There has been no significant change to the distribution of global tropical SSTs discussed in my May 18th posting (please review for details). La-Nina development during the next 3-6 months still remains a possibility.
The tropical convective forcing dynamical signal is well into the Western Hemisphere (WH). It is centered ~0/80W and is moving east at around 10m/s or roughly 7-8 deg long/day. Enhanced convection extends from the East Pacific ITCZ all the way into west central Africa. This signal has some projection onto a convectively coupled Kelvin wave. However, it is only a component of strong tropical-extratropical interactions that have occurred during the past few weeks. These interactions included the global mountain-frictional torque index cycle earlier this month within a general envelope of 20-30 day atmospheric variability.
Full disk satellite imagery not only shows the enhanced tropical convection across the WH, but also a loose consolidation of forcing centered ~5-10N/140E. The latter extends from eastern Indonesia into portions of the central Pacific. The Indian Ocean remains suppressed. However, strong enhancement is spreading across equatorial Africa as I type, and the Indian Ocean could become active much sooner than I think given the warm SSTs in that region.
It has been a real struggle trying to monitor these fast modes of tropical/extratropical variability and interactions. There has been no recent MJO signal, and as shown by the GWO phase space plot, our base state has been orbiting around GSDM Stage 1 since mid February. These orbits have come from competing tropical forcing from the East Indian and west Pacific Oceans, as well as mountain-frictional torque index cycles. Interactions with the mid-latitude synoptic eddies have maintained a loose AAM transport signal of fluxing momentum out of the subtropics into the mid-latitudes hence persisting a GSDM Stage 1 base state. Some of the past week 2-3 predictability “successes” for the USA have come from daily monitoring the GWO and AAM transport signals.
Most recently there has been the issue of whether or not an early onset to the Indian Monsoon would occur. In past discussions I have felt that was probable. However, per yearly ESRL/PSD time-latitude sections of OLRA, there was already enhanced convection across the Indian Ocean and portions of India at this time. Currently we have suppression there. My feeling is the current WH dynamical signal will be the catalyst needed to lead to the onset of the Indian Monsoon. Extrapolation would be in ~2 weeks, possibly much sooner given current satellite trends. However, my concerns about the warm west Pacific remain and a resumption of forcing from ~0/80-150E extending into the Southeast Asian monsoon region may occur by ~week 3 instead. Whatever does happen is unclear to me.
Animations of upper tropospheric vector wind anomalies shows twin tropical anticyclones centered ~80W as part of the WH dynamical signal. Even larger twin subtropical anticyclones are present ~150-160E (anomalies ~40m/s at 150mb) directly linked to the west Pacific convection locally forced by the warm SSTs. A strong Rossby wave energy dispersion across the North Pacific from these anticyclones is contributing to the present digging western USA trough. Not only have I struggled with the degree of amplification of this trough, but so have the models.
200mb zonal mean zonal wind anomalies (a good proxy for vertically integrated tropospheric AAM) remain above average throughout both the subtropical (~5m/s) and midlatitude (~10m/s) atmospheres of both hemispheres. Anomalous upper tropospheric subtropical easterly flow is returning to the Eastern Hemisphere and the recent extended North Pacific jet (for this time of year) is collapsing. Just how much easterly flow returns to the tropics and subtropics may have some dependency on the magnitude of the Indian Monsoon. If the west Pacific forcing continues to be an important component to the weather-climate system going into boreal summer, above average zonal mean tropical/subtropical westerly flow may be probable. My own feeling is the latter will have an influence. If so, speculation suggests a possible negative factor for Atlantic tropical cyclone development.
I think the weather-climate system is in a GSDM Stage 3-4 situation. I think Stage 4 is probable by week 2 and then Stage 1 afterwards. However, unlike much this past winter and spring, uncertainty is much higher than average. After an active week 1 for especially the Rockies and Plains, there should be a break by around the middle of next week. I like the solution offered by the ESRL/PSD ensemble suggesting more anomalous troughs particularly across the southwestern states starting ~day 10. Afterwards, a general western states trough and southeast USA ridge pattern is the most probable solution I can offer, especially by week 3. This would target the Northern Plains and Upper Mississippi Valley with rounds of MCS activity including severe storms and heavy rainfall, while intense heat occurs across the Deep South.
Appendix
An experimental phase space plot of the GSDM utilizing normalized relative AAM tendency (Y-axis) and normalized relative AAM (X-axis) can be found at
http://www.cdc.noaa.gov/map/images/gcm/gsdm_95d.jpg
These are probabilistic statements, and work is ongoing to quantify in future posts. The WB (2007) paper on the GSDM has been published in the February issue of MWR. I will try to post an update this Friday.
Ed Berry
Friday, May 18, 2007
Stage 3 Orbit -- Update
Reanalysis-1 (R1) data woes continue meaning ESRL/PSD AAM plots have not updated since May 11th.
The spatial distribution of global tropical SSTs remain similar to at least a week ago. Notable anomalies include the 1-2C warmth across the western Indian Ocean/Arabian Sea and west central Pacific, the latter as part of a horseshoe pattern into the extratropics. SST totals are ~30C for the former and ~29C across the latter. The equatorial cold tongue still has ~minus 1-3C anomalies down to about 200m with the coldest of ~-4C at 140W/100m (per TAO buoy data). However, the recent west Pacific westerly wind burst (WWB) may have initiated an oceanic downwelling Kelvin wave since at least plus 1C subsurface anomalies (~100m) are spreading east across the date line as I type. This situation could disrupt an evolution towards La-Nina. In any case, we have a warm west Pacific and cold east Pacific, only adding complexity.
The coupling of the recent global positive mountain-negative (decreasing) frictional torque index cycle and eastward shift of tropical forcing into the west central Pacific not only contributed to the strong WWB, but also added more westerly flow to the subtropical atmospheres than expected. Physical mechanisms for this coupling include upper tropospheric Rossby wave energy dispersion into the equatorial central Pacific from the East Asian topography and an upwelling convectively coupled Kelvin wave interacting with the Andes Mountains.
200mb zonal mean zonal wind anomalies of ~5m/s are present ~15S and 25N with even stronger anomalous westerly flow across the upper midlatitudes of both hemispheres. At least for the Northern Hemisphere, the roughly 5-10m/s anomalous zonal mean westerly flow centered ~45N goes back to poleward propagation off the equator tied to the December 2006 strong MJO event. It is possible these anomalous branches of westerly flow will combine during the next few weeks.
Full disk satellite imagery shows tropical convective forcing slowly increasing across the warm Indian Ocean and Arabian Sea while weakly hanging around the Bay of Bengal into western Indonesia. Only 2 tropical cyclones remain of the once intense west Pacific forcing. There is no MJO signal. In fact, since early April convectively coupled Kelvin waves have been the only eastward propagating modes within loosely a base state having both East Indian and west central-South Pacific Ocean tropical forcing. Currently there is one moving through the Western Hemisphere with another (the one that hit the Andes mountains) helping to excite the Indian Ocean convection. Could this be the “wave of the future” in what I have dubbed as a “new world atmosphere” in past discussions?
I think GSDM Stage 3 best describes the weather-climate situation. If updated, I suspect the Global Wind Oscillation (GWO) phase space plot would be orbiting toward Stage 3 similar to early April. I do think the tropical convective forcing across the Indian Ocean into western Indonesia/Southeast Asia will become dominate during the next few weeks. One contribution is a probable early onset of the Indian monsoon. The GWO should orbit toward GSDM Stage 4 then 1 later this month into early June.
My broken record predictions of probable occurrences of stormy patterns across the Rockies and Plains, attendant temperature extremes, etc., shifting north with the seasonal cycle, remains unchanged. I suspect most models are a bit too progressive with the western and central USA trough for early-mid next week. However, per issues discussed it will not persist for ~5 days across the western states as I thought a week ago. However, recall that week-2 ensemble means from all operational centers valid next week were predicting strong ridge conditions across the USA, which is not likely. There will be widespread severe storms and heavy rainfall across the central USA with this trough. The magnitude is still unclear.
By next weekend much of the central and east may have cooler than normal temperatures while the west coast starts to heat up. I think it is probable for more unseasonably strong troughs to impact the Pacific Northwest into the Plains later week 2 and week 3 with the return of GSDM Stage 4-1. In fact, monitoring will be needed to see if this situation becomes persistent for more than a few days. Weather ramifications should be obvious by now.
Appendix
An experimental phase space plot of the GSDM (depicting a global wind oscillation) utilizing normalized relative AAM tendency (Y-axis) and normalized relative AAM (X-axis) can be found at
http://www.cdc.noaa.gov/map/images/gcm/gsdm_95d.jpg
These are probabilistic statements, and work is ongoing to quantify in future posts. The WB (2007) paper on the GSDM has been published in the February issue of MWR. I will try to write an update sometime during Monday-Wednesday next week.
Ed Berry
The spatial distribution of global tropical SSTs remain similar to at least a week ago. Notable anomalies include the 1-2C warmth across the western Indian Ocean/Arabian Sea and west central Pacific, the latter as part of a horseshoe pattern into the extratropics. SST totals are ~30C for the former and ~29C across the latter. The equatorial cold tongue still has ~minus 1-3C anomalies down to about 200m with the coldest of ~-4C at 140W/100m (per TAO buoy data). However, the recent west Pacific westerly wind burst (WWB) may have initiated an oceanic downwelling Kelvin wave since at least plus 1C subsurface anomalies (~100m) are spreading east across the date line as I type. This situation could disrupt an evolution towards La-Nina. In any case, we have a warm west Pacific and cold east Pacific, only adding complexity.
The coupling of the recent global positive mountain-negative (decreasing) frictional torque index cycle and eastward shift of tropical forcing into the west central Pacific not only contributed to the strong WWB, but also added more westerly flow to the subtropical atmospheres than expected. Physical mechanisms for this coupling include upper tropospheric Rossby wave energy dispersion into the equatorial central Pacific from the East Asian topography and an upwelling convectively coupled Kelvin wave interacting with the Andes Mountains.
200mb zonal mean zonal wind anomalies of ~5m/s are present ~15S and 25N with even stronger anomalous westerly flow across the upper midlatitudes of both hemispheres. At least for the Northern Hemisphere, the roughly 5-10m/s anomalous zonal mean westerly flow centered ~45N goes back to poleward propagation off the equator tied to the December 2006 strong MJO event. It is possible these anomalous branches of westerly flow will combine during the next few weeks.
Full disk satellite imagery shows tropical convective forcing slowly increasing across the warm Indian Ocean and Arabian Sea while weakly hanging around the Bay of Bengal into western Indonesia. Only 2 tropical cyclones remain of the once intense west Pacific forcing. There is no MJO signal. In fact, since early April convectively coupled Kelvin waves have been the only eastward propagating modes within loosely a base state having both East Indian and west central-South Pacific Ocean tropical forcing. Currently there is one moving through the Western Hemisphere with another (the one that hit the Andes mountains) helping to excite the Indian Ocean convection. Could this be the “wave of the future” in what I have dubbed as a “new world atmosphere” in past discussions?
I think GSDM Stage 3 best describes the weather-climate situation. If updated, I suspect the Global Wind Oscillation (GWO) phase space plot would be orbiting toward Stage 3 similar to early April. I do think the tropical convective forcing across the Indian Ocean into western Indonesia/Southeast Asia will become dominate during the next few weeks. One contribution is a probable early onset of the Indian monsoon. The GWO should orbit toward GSDM Stage 4 then 1 later this month into early June.
My broken record predictions of probable occurrences of stormy patterns across the Rockies and Plains, attendant temperature extremes, etc., shifting north with the seasonal cycle, remains unchanged. I suspect most models are a bit too progressive with the western and central USA trough for early-mid next week. However, per issues discussed it will not persist for ~5 days across the western states as I thought a week ago. However, recall that week-2 ensemble means from all operational centers valid next week were predicting strong ridge conditions across the USA, which is not likely. There will be widespread severe storms and heavy rainfall across the central USA with this trough. The magnitude is still unclear.
By next weekend much of the central and east may have cooler than normal temperatures while the west coast starts to heat up. I think it is probable for more unseasonably strong troughs to impact the Pacific Northwest into the Plains later week 2 and week 3 with the return of GSDM Stage 4-1. In fact, monitoring will be needed to see if this situation becomes persistent for more than a few days. Weather ramifications should be obvious by now.
Appendix
An experimental phase space plot of the GSDM (depicting a global wind oscillation) utilizing normalized relative AAM tendency (Y-axis) and normalized relative AAM (X-axis) can be found at
http://www.cdc.noaa.gov/map/images/gcm/gsdm_95d.jpg
These are probabilistic statements, and work is ongoing to quantify in future posts. The WB (2007) paper on the GSDM has been published in the February issue of MWR. I will try to write an update sometime during Monday-Wednesday next week.
Ed Berry
Monday, May 14, 2007
Like Dealing with the Devil (It's complicated!)
The spatial pattern of Eastern Hemisphere tropical SSTs remains relatively unchanged with warmth across the Indian Ocean-cool Indonesia and warm west central Pacific. Largest anomalies and totals persist over the west central Indian Ocean into the Arabian Sea with magnitudes of plus 1-2C and greater than 30C respectively. Cooling continues along the equator east of the date line with values of at least minus 2C west of South America. Negative subsurface anomalies of at least minus 3C exist down to ~100m but positive anomalies greater than 1C down to ~300m are present west of the date line. A strong surface westerly wind burst (WWB) centered ~150-160E on the equator has been in progress for at least the past 5 days. There is some possibility for a downwelling oceanic Kelvin wave to develop as a response and transport some of this warm water to the east during the next few months. This is an example of why development of La-Nina is still a bit of an open question.
The Eastern Hemisphere tropical convective forcing loosely mirrors the SST distribution. One intense region remains relatively stationary ~0/100E while extending into the Bay of Bengal (including Tropical Cyclone 01B) and Southeast Asia while another area is over the west central Pacific. Overall, since the strong MJO event back in December 2006-January 2007, these 2 regions have been the dominate source of tropical forcing (equatorial Africa and tropical South America have been episodic). In fact, this behavior goes all the way back to the winter of 2001-2002. With the exception of the weak-moderate MJO during February, we have observed ~10-30 day excursions of tropical convection into the west central and South Pacific while forcing has loosely persisted ~90-120E.
Possibly related to the seasonal cycle, since late February I think there has been a close relationship between the eastward excursions of tropical convection into the west Pacific and a global mountain-frictional torque index cycle. The latter is a component of the GSDM having a broad periodicity of 10-60 days and is related to familiar teleconnection patterns such as the PNA (see WB (2007) for details). The point is while west Pacific tropical forcing has added anomalous westerly flow to the subtropics there has also been an additional source from the East Asian topography (for our purposes). These contributions have allowed extensions of the East Asian/North Pacific jet within an overall GSDM Stage 1 base state having tropical forcing across the East Indian Ocean. The jet extensions have contributed to the barrage of anomalously strong troughs into the western USA and associated extreme weather impacts. Numerical models have struggled predicting these situations especially for weeks 2-3.
The orbits around GSDM Stage 1 seen on the phase plot of the global wind oscillation (hopefully the most recent plot will be available soon) have been related to the above. Per reanalysis data plots through May 11th the global mountain torque is ~plus 30 Hadleys with the largest coming from the Andes Mountains (linked to a recent convectively coupled Kelvin wave) with a lesser component from East Asia. Global AAM tendency is ~plus 20 Hadleys meaning once again our overall GSDM Stage 1 base state is being perturbed with anomalous subtropical westerly flow. In fact, zonal mean westerly flow at 200mb is at least plus 5m/s throughout the subtropical atmospheres of both hemispheres.
I suspect the global wind oscillation signal is currently ~GSDM Stage 1.5. I do think there will be another orbit perhaps close to Stage 4 before going back to Stage 1. In any case, AAM transports have become strongly poleward (due to the tilts of the synoptic eddies) across the Northern Hemisphere since ~May 1st. A sink has developed ~35N with a source ~55N. The transport signal is largest contribution of the AAM budget, and in this case will maintain ~GSDM Stage 1. In fact, the only real difference between now and back ~December 1st, 2006, is the northward shift of this signal with the seasonal cycle.
During the next few weeks I think the tropical convection will increase in coverage across the Eastern Hemisphere including the Indian Ocean from ~40-120E (with a contribution from the currently very active convection across Africa). An early onset to the Indian monsoon is probable. Flare-ups will continue across the west Pacific. I remain firm on my predictions of more strong troughs to impact the western USA starting next week. The models are “all over the place” on catching up to the atmosphere and synoptic details are unclear. I think this situation may persist into June shifting northwest with the seasonal cycle. Probable weather ramifications include exceptional outbreaks of severe storms again across the Plains and early summertime heat across the Deep South and portions of the East.
Appendix
An experimental phase space plot of the GSDM utilizing normalized relative AAM tendency (Y-axis) and normalized relative AAM (X-axis) can be found at
http://www.cdc.noaa.gov/map/images/gcm/gsdm_95d.jpg
Recent data issues have caused availability problems with this plot. My apologies.
These are probabilistic statements, and work is ongoing to quantify in future posts. The WB (2007) paper on the GSDM has been published in the February issue of MWR. I will try to post an update this Friday.
Ed Berry
The Eastern Hemisphere tropical convective forcing loosely mirrors the SST distribution. One intense region remains relatively stationary ~0/100E while extending into the Bay of Bengal (including Tropical Cyclone 01B) and Southeast Asia while another area is over the west central Pacific. Overall, since the strong MJO event back in December 2006-January 2007, these 2 regions have been the dominate source of tropical forcing (equatorial Africa and tropical South America have been episodic). In fact, this behavior goes all the way back to the winter of 2001-2002. With the exception of the weak-moderate MJO during February, we have observed ~10-30 day excursions of tropical convection into the west central and South Pacific while forcing has loosely persisted ~90-120E.
Possibly related to the seasonal cycle, since late February I think there has been a close relationship between the eastward excursions of tropical convection into the west Pacific and a global mountain-frictional torque index cycle. The latter is a component of the GSDM having a broad periodicity of 10-60 days and is related to familiar teleconnection patterns such as the PNA (see WB (2007) for details). The point is while west Pacific tropical forcing has added anomalous westerly flow to the subtropics there has also been an additional source from the East Asian topography (for our purposes). These contributions have allowed extensions of the East Asian/North Pacific jet within an overall GSDM Stage 1 base state having tropical forcing across the East Indian Ocean. The jet extensions have contributed to the barrage of anomalously strong troughs into the western USA and associated extreme weather impacts. Numerical models have struggled predicting these situations especially for weeks 2-3.
The orbits around GSDM Stage 1 seen on the phase plot of the global wind oscillation (hopefully the most recent plot will be available soon) have been related to the above. Per reanalysis data plots through May 11th the global mountain torque is ~plus 30 Hadleys with the largest coming from the Andes Mountains (linked to a recent convectively coupled Kelvin wave) with a lesser component from East Asia. Global AAM tendency is ~plus 20 Hadleys meaning once again our overall GSDM Stage 1 base state is being perturbed with anomalous subtropical westerly flow. In fact, zonal mean westerly flow at 200mb is at least plus 5m/s throughout the subtropical atmospheres of both hemispheres.
I suspect the global wind oscillation signal is currently ~GSDM Stage 1.5. I do think there will be another orbit perhaps close to Stage 4 before going back to Stage 1. In any case, AAM transports have become strongly poleward (due to the tilts of the synoptic eddies) across the Northern Hemisphere since ~May 1st. A sink has developed ~35N with a source ~55N. The transport signal is largest contribution of the AAM budget, and in this case will maintain ~GSDM Stage 1. In fact, the only real difference between now and back ~December 1st, 2006, is the northward shift of this signal with the seasonal cycle.
During the next few weeks I think the tropical convection will increase in coverage across the Eastern Hemisphere including the Indian Ocean from ~40-120E (with a contribution from the currently very active convection across Africa). An early onset to the Indian monsoon is probable. Flare-ups will continue across the west Pacific. I remain firm on my predictions of more strong troughs to impact the western USA starting next week. The models are “all over the place” on catching up to the atmosphere and synoptic details are unclear. I think this situation may persist into June shifting northwest with the seasonal cycle. Probable weather ramifications include exceptional outbreaks of severe storms again across the Plains and early summertime heat across the Deep South and portions of the East.
Appendix
An experimental phase space plot of the GSDM utilizing normalized relative AAM tendency (Y-axis) and normalized relative AAM (X-axis) can be found at
http://www.cdc.noaa.gov/map/images/gcm/gsdm_95d.jpg
Recent data issues have caused availability problems with this plot. My apologies.
These are probabilistic statements, and work is ongoing to quantify in future posts. The WB (2007) paper on the GSDM has been published in the February issue of MWR. I will try to post an update this Friday.
Ed Berry
Friday, May 11, 2007
Update on the Return
Shift work obligations and data issues preclude a complete discussion. I will try to be more comprehensive Monday-Wednesday next week.
There is no change from my thinking as discussed on 5/8. Global tropical SSTs remain similar and any development of La-Nina is still a monitoring issue. There has been a rapid coherent eastward shift of tropical convective forcing across the Eastern Hemisphere which does project onto a convectively coupled Kelvin wave. The centroid of this forcing is ~0/140E having recent 3-day OLRA less than minus 70 W/m**2. In fact, a surface westerly wind burst is accompanying this convection and may adversely impact development toward a cold event. This recent eastward shift has some similarities to the behavior of the tropical convective forcing seen during late March-early April. Tropical forcing also remains active across the Indian Ocean and even the South Pacific.
I think we are headed for a transient GSDM Stage 2 response for the early-mid part of next week (also seen during the first part of April), and most models have captured this evolution. As both the NWS/CPC and SPC forecasts show, probable weather impacts include heavy rainfall and severe storms focusing on the central-northern Plains and Upper Mississippi Valley.
However, I also think there will remain the issue of two regions of Eastern Hemisphere tropical convective forcing, the Indian Ocean and the west central Pacific (along with other matters). This favors a GSDM Stage 4-1 response meaning more western USA troughs interacting with above average subtropical jets. Hence I disagree with many week-2 ensemble means from various operational centers and recent official forecasts derived from them suggesting ridge conditions across the USA for that period. Shifted northwest, I am holding the line of resumption of exceptionally active weather for the Rockies and Plains perhaps starting as early as next weekend and continuing into week 3 (~19 May – June 1). Ramifications include more severe storms and flooding rainfall for the central and northern Plains, summertime heat across the Southeast and cool conditions with heavy snowfall for the Rockies. Recent ensemble numerical models have been starting to trend toward this prediction.
Appendix
An experimental phase space plot of the GSDM (depicting a global wind oscillation) utilizing normalized relative AAM tendency (Y-axis) and normalized relative AAM (X-axis) can be found at
http://www.cdc.noaa.gov/map/images/gcm/gsdm_95d.jpg
These are probabilistic statements, and work is ongoing to quantify in future posts. The WB (2007) paper on the GSDM has been published in the February issue of MWR. I will try to write an update sometime Monday-Wednesday next week.
Ed Berry
There is no change from my thinking as discussed on 5/8. Global tropical SSTs remain similar and any development of La-Nina is still a monitoring issue. There has been a rapid coherent eastward shift of tropical convective forcing across the Eastern Hemisphere which does project onto a convectively coupled Kelvin wave. The centroid of this forcing is ~0/140E having recent 3-day OLRA less than minus 70 W/m**2. In fact, a surface westerly wind burst is accompanying this convection and may adversely impact development toward a cold event. This recent eastward shift has some similarities to the behavior of the tropical convective forcing seen during late March-early April. Tropical forcing also remains active across the Indian Ocean and even the South Pacific.
I think we are headed for a transient GSDM Stage 2 response for the early-mid part of next week (also seen during the first part of April), and most models have captured this evolution. As both the NWS/CPC and SPC forecasts show, probable weather impacts include heavy rainfall and severe storms focusing on the central-northern Plains and Upper Mississippi Valley.
However, I also think there will remain the issue of two regions of Eastern Hemisphere tropical convective forcing, the Indian Ocean and the west central Pacific (along with other matters). This favors a GSDM Stage 4-1 response meaning more western USA troughs interacting with above average subtropical jets. Hence I disagree with many week-2 ensemble means from various operational centers and recent official forecasts derived from them suggesting ridge conditions across the USA for that period. Shifted northwest, I am holding the line of resumption of exceptionally active weather for the Rockies and Plains perhaps starting as early as next weekend and continuing into week 3 (~19 May – June 1). Ramifications include more severe storms and flooding rainfall for the central and northern Plains, summertime heat across the Southeast and cool conditions with heavy snowfall for the Rockies. Recent ensemble numerical models have been starting to trend toward this prediction.
Appendix
An experimental phase space plot of the GSDM (depicting a global wind oscillation) utilizing normalized relative AAM tendency (Y-axis) and normalized relative AAM (X-axis) can be found at
http://www.cdc.noaa.gov/map/images/gcm/gsdm_95d.jpg
These are probabilistic statements, and work is ongoing to quantify in future posts. The WB (2007) paper on the GSDM has been published in the February issue of MWR. I will try to write an update sometime Monday-Wednesday next week.
Ed Berry
Tuesday, May 08, 2007
Exceptionally Active Weather for USA Probable Weeks 2-3
The spatial distribution of global tropical SSTs features warmth across the Indian Ocean-cool Indonesia-warm west central into South Pacific. Locations across the equatorial Pacific east of ~170W are again cooling while the Atlantic remains generally warm. Anomaly magnitudes are roughly 0.5-1C but near 2C just west of South America and portions of the equatorial Atlantic. SST totals remain ~30C across both the Indian and west Pacific basins and recently the east Pacific ~10N. Subsurface anomalies ~minus 3-4C remain along the equator around 130-140W at 100m within a cool reservoir down to ~200m from the west coast of South America to the date line. Development of La-Nina remains a monitoring issue but is appearing more likely.
Tropical convective forcing has become quite intense centered around 0/140E while extending in a west-northwest to east-southeast band from the Bay of Bengal into the South Pacific. This represents a fairly rapid eastward shift from a week ago. I attribute this change to strong complex interactions with the extratropics including a weak-moderate positive global and East Asian mountain torque during late April. This behavior is similar to what happened around April 1st, but much weaker. For instance, the global mountain torque around April 1st was ~plus 45 Hadleys while only 15 Haldeys recently. In any case, since about mid-February we have seen ~10-30 day variations involving global mountain torques, East Asia jet extensions and transient eastward shifts of tropical forcing across the Eastern Hemisphere. This has been in what we feel is a base state best described as GSDM Stage 1, and is seen from the quasi-phase space plot per link in the Appendix. Stated another way, the global wind has been oscillating (orbiting in phase space) around GSDM Stage 1, with the largest late March-late April. I see no reason for this end for at least weeks 2-3.
Zonal mean upper tropospheric westerly flow has increased slightly throughout the tropical and subtropical atmospheres, with anomalies ~2-5m/s. I expect this anomalous westerly flow will propagate to the midlatitudes and contribute to yet another intensification of the East Asian/North Pacific jet weeks 2-3. As already supported by full disk satellite and wind animation trends, tropical convective forcing should become more robust across the Indian Ocean weeks 2-3 while remaining active in other regions like the west Pacific. For the lower 48 states (my focus in these writings) this all suggests more strong troughs interacting with subtropical jets impacting the western USA ~forecast days 10-25.
The probable weather ramifications would be similar to what has already occurred several times since late February. A difference is for the general southwest flow storm track across the Plains to be farther northwest. Thus exceptional outbreaks of severe storms may again occur across the Plains perhaps starting by around next weekend.
Appendix
An experimental phase space plot of the GSDM utilizing normalized relative AAM tendency (Y-axis) and normalized relative AAM (X-axis) can be found at
http://www.cdc.noaa.gov/map/images/gcm/gsdm_95d.jpg
These are probabilistic statements, and work is ongoing to quantify in future posts. The WB (2007) paper on the GSDM has been published in the February issue of MWR. I will try to post an update this Friday while having to cover operational shifts.
Ed Berry
Tropical convective forcing has become quite intense centered around 0/140E while extending in a west-northwest to east-southeast band from the Bay of Bengal into the South Pacific. This represents a fairly rapid eastward shift from a week ago. I attribute this change to strong complex interactions with the extratropics including a weak-moderate positive global and East Asian mountain torque during late April. This behavior is similar to what happened around April 1st, but much weaker. For instance, the global mountain torque around April 1st was ~plus 45 Hadleys while only 15 Haldeys recently. In any case, since about mid-February we have seen ~10-30 day variations involving global mountain torques, East Asia jet extensions and transient eastward shifts of tropical forcing across the Eastern Hemisphere. This has been in what we feel is a base state best described as GSDM Stage 1, and is seen from the quasi-phase space plot per link in the Appendix. Stated another way, the global wind has been oscillating (orbiting in phase space) around GSDM Stage 1, with the largest late March-late April. I see no reason for this end for at least weeks 2-3.
Zonal mean upper tropospheric westerly flow has increased slightly throughout the tropical and subtropical atmospheres, with anomalies ~2-5m/s. I expect this anomalous westerly flow will propagate to the midlatitudes and contribute to yet another intensification of the East Asian/North Pacific jet weeks 2-3. As already supported by full disk satellite and wind animation trends, tropical convective forcing should become more robust across the Indian Ocean weeks 2-3 while remaining active in other regions like the west Pacific. For the lower 48 states (my focus in these writings) this all suggests more strong troughs interacting with subtropical jets impacting the western USA ~forecast days 10-25.
The probable weather ramifications would be similar to what has already occurred several times since late February. A difference is for the general southwest flow storm track across the Plains to be farther northwest. Thus exceptional outbreaks of severe storms may again occur across the Plains perhaps starting by around next weekend.
Appendix
An experimental phase space plot of the GSDM utilizing normalized relative AAM tendency (Y-axis) and normalized relative AAM (X-axis) can be found at
http://www.cdc.noaa.gov/map/images/gcm/gsdm_95d.jpg
These are probabilistic statements, and work is ongoing to quantify in future posts. The WB (2007) paper on the GSDM has been published in the February issue of MWR. I will try to post an update this Friday while having to cover operational shifts.
Ed Berry
Wednesday, May 02, 2007
Stuck
Weekly mean sea surface temperatures (SST) remain well above average across the Indian Ocean and weakly so over the west Pacific with magnitudes ~0.5-1C. SSTs greater than 30C are present from the Indian Ocean into the Bay of Bengal, decreasing to ~29C across the central and South Pacific. In response to increasing trades, negative SST anomalies have been strengthening around the equatorial date line while persisting west of South America. In the subsurface negative temperature anomalies of 3-4C remain at ~100 meters depth along the east Pacific cold tongue. There is still uncertainty about the intensity of any upcoming cold event, particularly since SSTs have also cooled to below normal around Indonesia. The latter is reminiscent of last fall, when we had a similar warm-cool-warm distribution of Eastern Hemisphere tropical SSTs.
The MJO signal remains incoherent. A few weeks ago I thought this mode of tropical convective variability would emerge across the Indian Ocean by now. Even though fairly intense convection is centered ~0/100E, MJO evolution appears less likely for the next 1-2 weeks. Full disk satellite imagery and other monitoring tools show that enhanced tropical rainfall has persisted across much of the eastern Indian Ocean for about the last week (OLRA ~minus 50-70 W/m**2). More recently a separate but weaker region of enhancement has developed over the west central Pacific. This mirrors the SST distribution discussed above. However, I think we are in a stationary or slowly evolving situation which is focusing the most intense forcing around 100E. Meanwhile, much faster tropical modes such as convectively coupled Kelvin waves and interactions with the extratropics are leading to flare-ups across other regions including the west Pacific.
Zonal mean easterly wind flow anomalies of ~5m/s continue over much of the equatorial and subtropical atmospheres helping to keep the global relative AAM low (~1.5 standard deviations below the reanalysis climatology). However, recently the global AAM tendency has become positive, reaching about 15 Hadleys. I attribute that to a positive East Asian mountain torque forced by a Rossby wave energy dispersion (RWD) and also an equatorial source forced by west Pacific tropical convection. This RWD has arced from north Asia into the central Pacific during the last 5-7 days while interacting not only with the tropical forcing at 100E, but also from the west Pacific. This RWD will lead to a strong western USA trough by the upcoming weekend, as shown by the numerical models. An enhanced probability of more western states troughs by this time was suggested in my April 20th posting.
The global circulation remains in GSDM Stage 1, and unless the character of the tropical forcing discussed above changes, we should roughly remain in that state for at least weeks 1-2. Stated another way, the global wind signal may orbit in phase space tilted toward GSDM Stage 1. If this situation persists through the rest of this month, I think it is more probable for a La-Nina to develop. For example, stationary tropical convective forcing across the Indian Ocean/Indonesia favors strong trades across the central and eastern equatorial Pacific, allowing upwelling of the colder subsurface waters currently present. For weeks 1-3, I think there will be another respite in the stormy regime across the USA by around the middle of next week, only to resume by week 3 but somewhat shifted northwest.
Appendix
An experimental phase space plot of the GSDM utilizing normalized relative AAM tendency (Y-axis) and normalized relative AAM (X-axis) can be found at
http://www.cdc.noaa.gov/map/images/gcm/gsdm_95d.jpg
These are probabilistic statements, and work is ongoing to quantify in future posts. The WB (2007) paper on the GSDM has been published in the February issue of MWR. My next posting will not be until next week.
Ed Berry and Klaus Weickmann
Subscribe to:
Posts (Atom)