The following is a link to our recently accepted paper by MWR which discusses the GSDM (Weickmann and Berry 2006).
http://www.cdc.noaa.gov/MJO/Predictions/wb2006.pdf
From taking into consideration the interactions of 4 different subseasonal time scales, a sequence of maps depicting a coherent set of repeatable events has been derived for the Northern Hemisphere cold season from November-March. This set is broken up into 4 stages, referred to as GSDM (for Global Synoptic-Dynamic Model) Stages 1-4 in the text of my Blog. Figure 13 in our paper presents a schematic of the GSDM. Ideally it would be advantageous to post our weather-climate discussions with greater frequency to provide additional detail while having a more complete weather-climate record of attribution and prediction. In these discussions I adapt the GSDM for the warm season. Our list of work includes a seasonally adjusted rendition of the GSDM.
Our latest weather-climate discussion dated August 18th, 2006 (and updated September 9th), has been posted on the ESRL/PSD MJO web site at
http://www.cdc.noaa.gov/MJO/Forecasts/climate_discussions.html
Please see past postings for web site links. I am going to discontinue inserting most of them in an effort for brevity. I also need to do the same with these postings.
Global tropical SSTs remain quite warm across the Western Hemisphere and the western/central Indian Ocean, with the greatest positive anomalies around the equatorial date line and the Eastern Pacific cold tongue. Magnitudes in the latter areas were at least plus 2C. In addition, the entire equatorial basin from ~160E to the west coast of South America has observed weekly mean (September 3-9, 2006) positive SST anomalies of ~1-2C. The latest 5-day averaged TAO buoy array data indicates anomalies up to plus 4C around 140W on the equator at 100m depth, with plus 1-2C anomalies common at depths of 100m east of the date line.
Anomalies of roughly plus .5-1.5C were still present across the Atlantic and much of the Indian Ocean. Below normal SSTs ~minus 1-2C continue around Indonesia, particularly south of the equator to the west coast of Australia. A thought is that the combination of cross-equatorial southerly flow linked to Southern Hemisphere cold outbreaks and upwelling has led to these cool anomalies. Hence we see a pattern of generally a “warm Indian Ocean-cool Indonesian region-warm date line region” in regard to SSTAs, typical of a mature warm ENSO event.
During much of the boreal summer, westerly wind anomalies and even actual westerlies have been common particularly along the equatorial date line region, leading to a deepening of the oceanic thermocline along the equatorial cold tongue (discussed above). However, during the last 5-10 days these westerly anomalies have weakened considerably with even weak easterly anomalies. More said about this below.
Actual SSTs in excess of 29C (threshold we use to maintain significant tropical convective forcing) remain present across portions of the Indian Ocean, and especially the equatorial date line and regions of the Caribbean. These SSTs are most extensive from ~150E-180 within 10 degrees of the equator (see links for further details).
Per the latest ENSO diagnostic discussion dated September 13th, 2006, “El Niño conditions have developed and are likely to continue into early 2007” (please see link below). I would agree with that, and only confirms some of the scientific issues discussed in past writings on this Blog. I sincerely applaud CPC for being proactive to get this information out to everyone!!
Nevertheless, I hope to make the point that the magnitude (and duration) of this event as we go into boreal winter, including global impacts, are unclear (understanding other signals such as trends and what statistics offer). There has been a lot of complicated random (stochastic) forcing going on in the coupled atmosphere-ocean system since at least April 2006. Some of these behaviors have been detailed in our latest weather-climate discussion (link above), and are outstanding research issues (let alone using these kind of notions to make predictions). Right now, only careful weather-climate monitoring within the GSDM framework offers any “hope” of catching these kind of complicated highly non-linear dynamical behaviors in real-time.
The following are links to ENSO discussions.
http://www.cdc.noaa.gov/people/klaus.wolter/MEI/
http://www.cpc.ncep.noaa.gov/products/analysis_monitoring/enso_advisory/index.html
Please also see the following CPC link (and others therein) for further ENSO, etc., insights, and remember that official USA information on anything related to ENSO comes from CPC.
http://www.cpc.ncep.noaa.gov/products/predictions/90day/
From monitoring, I do feel that the events leading to the onset of weak warm event conditions across the equatorial Pacific Ocean has had at least “episodic impacts” to the global weather during boreal summer. These include general suppression (thus far) of the Tropical North Atlantic tropical cyclone season (understanding climatology and the situation right now), the increase of Tropical Northwest Pacific tropical cyclones (ex., southeast China), the excessive heat much of the USA has dealt with, and the recent change to a cooler and wetter weather pattern for many locations across the Great Plains. The important point to make is there are always forcing-response-feedbacks going on within the Earth-atmosphere-ocean system, and care needs to be offered to thinking that, “some kind of an event is too weak to have an impact”. While there is some truth to these kind of statements statistically (on average), from a weather-climate linkage point of view these notions can lead to difficulty when trying to capture the possibility of extreme weather events. Even on a case by case basis, statistically useful information can be offered for the latter when use of the appropriate framework is employed.
In contrast to the past few months (at least), there are actually at least a couple of weather-climate linkage signals to discuss. The flare-up across the equatorial Indian Ocean (linked to Rossby wave energy dispersions from the North Atlantic) discussed early last week has evolved into a convectively coupled mode at least weakly projecting onto a Madden-Julian Oscillation (MJO). Latest weakly mean OLR anomalies centered ~5-10N/70E were around minus 50-70W/m**2, and a rough calculation gives a phase speed for eastward movement of 5m/s (~4 deg long/day) for this feature (there is also a component moving northeast through India and the Bay of Bengal). The Wheeler phase space plot also lends some support to an MJO. The coherent modes modes Hovmollers show a very weak MJO projection, and also a Kelvin wave emanating to the east. Latest satellite imagery suggests the core of this tropical convective forcing centered ~5-10N/95E, with a Kelvin wave signature moving east along the equator.
There is also a second, less concentrated and weaker area of tropical convective forcing centered along and just north of the date line being forced by the very warm SSTs (discussed above) and other processes. A third (and even weaker) region exists across the Tropical Northeast Pacific. Loosely (for brevity) these last two regions represent an ENSO signal. The forcing across the Tropical North Atlantic and Africa is not well organized.
Now we come to the punch line of this posting that I hope to make clear. We have the convectively coupled dynamical forcing signal over the Indian Ocean and the SST boundary forcing around the date line of the central Pacific Ocean. That is, two areas of tropical forcing, and has been a behavior generally observed since early 2002 (global warming signal?). Which area (ocean) is going to dominate as we go into boreal winter? Obviously there are seasonal cycle considerations and perhaps that may be all we are seeing. Recall that the SSTs are warm across both regions of forcing, with the date line being the warmest where there has been less cloud cover and rainfall recently. Some brief thoughts follow.
Per animations of 150mb and 250mb daily mean vector wind anomalies along with additional tools such as Hovmollers of 250mb meridional wind anomalies, anomalous circulation features have reversed across the subtropical Eastern Hemisphere during the last week. There are now twin anomalous (~10-20m/s, at least) upper tropospheric subtropical anticyclones across the western Indian Ocean and downstream twin cyclones across Indonesia (forced by the divergent outflow) with gyres of the opposite sense in the lower troposphere (leading to some resumption of surface easterly wind anomalies at the date line). This is the expected baroclinic response from a convectively coupled mode such as a MJO.
Impacts onto the extratropics of both hemispheres from the Indian Ocean forcing are currently quite robust. As I type an intense Rossby wave energy dispersion is arcing from this tropical forcing across the North Pacific rim leading to the western USA trough that the numerical models are predicting for the next several days.
Impacts from the date line tropical convection are less robust. Twin subtropical anticyclones continue to appear “off and on”, and have contributed to the subtropical jet (STJ) currently extending into the Desert Southwest. The point is the Indian Ocean tropical forcing is currently dominating the global tropical/subtropical circulation (loosely).
Global AAM signals are still relatively weak and mixed (ex., the mountain torque). There are still regions particularly across the Southern Hemisphere where zonal mean contributions are large particularly from the frictional and possibly the Coriolis torques. Based on the reanalysis data plots through September 10th, global tropospheric relative AAM is ~minus 1 sigma below the 1968-1997 climatology and a bit lower based on the 1979-1998 climatology. The global tendency has become slightly negative with much of that coming from the subtropical atmosphere of both hemispheres and the northern midlatitudes. A time-latitude section of 200mb zonal mean zonal wind anomalies supports this notion, and even shows very weak zonal mean westerly wind anomalies (~2-3m/s) in the equatorial atmosphere. I feel I can link the former with the Indian Ocean forcing and the latter with the date line convection. Speaking for the Asia-North American sector, this is why we are seeing breaking anticyclones across the North Pacific with accelerating westerly flow farther south.
To summarize, I think we have 1) a weak warm ENSO event, 2) a convectively coupled dynamical signal across the Indian Ocean weakly projecting onto a MJO, and 3) a lot of noise including that given by at least 2 areas of tropical convective forcing. There is also an on-going sub-monthly mountain-frictional torque index cycle (not discussed). We also need to think about the role of the seasonal cycle as we transition into boreal autumn, which also adds a huge source of uncertainty. I do think that GSDM Stage 1 best describes the current weather-climate situation.
So, where does the atmosphere go from here? Uncertainty remains as high as it gets. I do think there is some possibility for at least a convectively coupled Kelvin wave to propagate into the western Pacific adding some enhancement to the tropical convection in that region by the end of week 2. It would be most probable for any MJO component to propagate northeast (seasonal cycle) through the Bay of Bengal into the Tropical Northwest Pacific during week 2 and/or week 3. Hence we may observe enhanced tropical convection from the date line to far Southeast Asia by the end of week 2, shifting east week 3 (?). While all this is going on, tropical convection may continue to “hang out” across the equatorial Indian Ocean (SSTs may become at least temporarily to cool to support thunderstorm clusters) perhaps not as intense as what may be occurring across the Northwest Pacific by then. A thought would be to offer GSDM Stage 1 for week 1, transitioning to GSDM Stage 2 for weeks 2-3. Yes, we may see the North Pacific Jet “outrun” the convection anytime (adds more uncertainty).
I also need to add that, on average, the most intense tropical convective forcing could remain across the Indian Ocean during the next few months, which could “affect” any further development of our weak warm ENSO. To me, it will be critical to see how all this tropical forcing possibly becomes more coherent as transition from boreal autumn to winter occurs.
Week 1 (14-20 September 2006): GSDM Stage 1 is most probable. Like nearly all the models show, 1-2 strong mobile synoptic baroclinic troughs digging into the western part of the country then heading east (in a very complicated flow – I cannot talk about “everything” in these postings) is probable. Portions of the Northern Rockies are likely to experience their first heavy snowfall for this upcoming cold season while severe local storms are probable on the Plains. While temperatures change to much colder than normal across the western states, much of the east and Deep South will keep summertime. The Tropical North Atlantic will need to be monitored for any additional cyclone formation. Right now conditions for tropical cyclogenesis there may be the most favorable thus far for 2006. Please see http://www.nhc.noaa.gov/ for the latest tropical cyclone information.
Week 2 (21-27 September 2006): A transition to GSDM Stage 2 may be most probable, meaning an eastward shift of the week 1 pattern across the USA. The trough position may be become established ~95-100W with the ridge just off the west coast into Alaska. Synoptic features would be expected to modulate this pattern.
Week 3 (28-04 October 2006): Persistence of GSDM Stage 2, otherwise unclear.
Once again Southwest Kansas is on the “fence” with a southwest flow storm track. However, there will be a STJ interacting with the strong mobile troughs, and opportunities for some rainfall and storms should exist week 1. The better opportunities will be to our north and east. For weeks 2-3, with a trough axis possibly near or just east of us, we may have a situation of “relatively cool dry northwest flow”. However, individual synoptic systems may shift the trough far enough west to give opportunities of rainfall. Finally, closed lows across the southwest states may also become more probable over the next few weeks interacting with the STJ. This may also be favorable for precipitation across Southwest Kansas.
It is unlikely I will be able to do another posting until about the middle of next week (roughly Tuesday-Wednesday 9/19-20).
Ed Berry
Wednesday, September 13, 2006

Tuesday, September 05, 2006
Next Chapter of the New World Atmosphere – Randomness Rules!!!
The following is a link to our recently accepted paper by MWR which discusses the GSDM (Weickmann and Berry 2006).
http://www.cdc.noaa.gov/MJO/Predictions/wb2006.pdf
From taking into consideration the interactions of 4 different subseasonal time scales, a sequence of maps depicting a coherent set of repeatable events has been derived for the Northern Hemisphere cold season from November-March. This set is broken up into 4 stages, referred to as GSDM (for Global Synoptic-Dynamic Model) Stages 1-4 in the text of my Blog. Figure 13 in our paper presents a schematic of the GSDM. Ideally it would be advantageous to post our weather-climate discussions with greater frequency to provide additional detail while having a more complete weather-climate record of attribution and prediction. In these discussions I adapt the GSDM for the warm season. Our list of work includes a seasonally adjusted rendition of the GSDM.
Our latest weather-climate discussion dated August 18th, 2006, has been posted on the ESRL/PSD MJO web site at
http://www.cdc.noaa.gov/MJO/Forecasts/climate_discussions.html
Please see past postings for web site links. I am going to discontinue inserting most of them in an effort for brevity. I also need to do the same with these postings.
The distribution of global tropical SSTs have remained fairly persistent during the last couple of weeks. Western Hemisphere tropical Pacific SSTs remain above normal, with weekly mean anomalies (8/20-26) ~plus 1-2C. The largest magnitudes were centered near the equatorial date line and just west of South America, where daily mean anomalies close to plus 3C were observed on September 4th for the latter (seasonal cycle of SSTs contributing). Anomalies of roughly plus .5-1.5C were still present across the Atlantic and much of the Indian Ocean. Below normal SSTs ~minus 1-2C continue around Indonesia, particularly south of the equator. Hence we see a pattern of a “warm Indian Ocean-cool Indonesian region-warm date line region” in regard to SSTAs, typical of a mature warm ENSO event.
Persistent westerly wind anomalies (~3-5 m/s from about 140E-180) and even actual westerlies have continued to deepen the oceanic thermocline along the equatorial cold tongue. In fact, latest TAO buoy data show anomalies ~plus 4C at 100m depth ~140W, and I may be able to make the case for 2 oceanic Kelvin waves currently propagating east along the cold tongue thermocline.
Actual SSTs in excess of 29C (threshold we use to maintain significant tropical convective forcing) remain present across portions of the Indian Ocean, equatorial date line and regions of the Caribbean. These SSTs are most extensive from ~150E-180 within 10 degrees of the equator (see links for details). An important point is SST boundary forcing has been contributing to multiple regions of enhanced tropical convection, with episodic flare-ups particularly across the Indian Ocean and date line areas during the past several weeks. This has masked any real coherent signals of tropical forcing that may still exist, and for all intents and purposes there is no MJO signal, nor any more modes of 30 and 50-day processes. Much of the tropical forcing is random with little organization.
This is interesting since the spatial distribution of global tropical SSTs may not be random, but slowly evolving in a coherent manner. I have a thought that as the seasonal (southward) migration of tropical convection occurs west of the date line; perhaps by the December 2006-January 2007 time frame SST boundary forced convection in the region of the date line may start to dominate. A secondary region may also continue across the Indian Ocean. This evolution would be consistent with the onset of a mature phase of a warm event. Again, I reiterate that I think the atmosphere is tilting toward a warm ENSO event (magnitude unclear), and some indices would offer a weak warm event has already emerged. What I stated above is pure speculation which I cannot defend at this time. The following are links to ENSO discussions.
http://www.cdc.noaa.gov/people/klaus.wolter/MEI/
http://www.cpc.ncep.noaa.gov/products/analysis_monitoring/enso_advisory/index.html
Please also see the following CPC link (and others therein) for further ENSO, etc., insights, and remember that official USA information on anything related to ENSO comes from CPC.
http://www.cpc.ncep.noaa.gov/products/predictions/90day/
From monitoring, I do think this developing situation (possible warm ENSO) has had at least “episodic impacts” to the global weather during boreal summer. These include general suppression (thus far) of the Tropical North Atlantic (TNA) tropical cyclone season (understanding climatology), the increase of Tropical Northwest Pacific (TNWP) tropical cyclones (ex., southeast China), and the excessive heat much of the USA has dealt with.
Obviously weather-climate linkage signals are very weak. There are interactions which are certainly not linear and random that has been occurring for a while, and I only want to summarize the (hopefully) important behaviors for brevity. Right now I think the most robust tropical convective signal is emerging across the equatorial Indian Ocean (OLRA ~ minus 50-70 W/m**2), and I think Rossby wave energy dispersion (RWD) processes moving through the North Atlantic/Scandinavia are contributing. Other regions remain north of the date line, around the Americas and finally the TNA into Africa. Various plots of velocity potential suggest the latter is a convectively coupled dynamical signal which may emerge into the Indian Ocean during the next week or so.
The tropical convection across the Indian Ocean is linked with upper tropospheric westerlies (see animations of 150mb and 250mb daily mean vector wind anomalies), perhaps suggestive of extratropical dynamical forcing. The coherent modes Hovmoller plots suggest a convectively coupled Kevin wave to develop from this enhanced rainfall and move east. My own thought would support that notion, possibly leading to increased enhancement of tropical convection from the date line region toward the Philippines sometime during week 2. Convection may also remain enhanced across the Indian Ocean as the weak dynamical signal comes into the Eastern Hemisphere. Models such as the CDC and NCEP ensemble maintain precipitation across these 2 areas during week 2 largely responding to the SSTs.
Per animations of 150mb and 250mb daily mean vector wind anomalies, around September 2nd nearly symmetric RWDs linked to twin subtropical anticyclones ~120E occurred in both hemispheres. Circulation anomalies were roughly 20-30m/s at 150mb. The Northern Hemisphere version went across the Pacific Rim and lead to the anomalous cyclone that was across the Northern Plains while its counterpart led to a significant cold outbreak across much of South America. This pattern has dispersed, with currently a lot of northeast-southwest tilt (AAM transport signals were still weak 3 days ago per reanalysis data) to the anomalies from Asia to North America. There is a “hint” that the twin anomalous subtropical anticyclones are currently shifting west toward the Indian Ocean convection. Finally I should mention that twin anticyclones (with generally weak anomalies) keep “coming and going” around the equatorial date line region. The latter is likely a warm ENSO signal.
Global AAM signals are much too weak to discuss. There are regions particularly across the Southern Hemisphere where zonal mean contributions are large particularly from the frictional and possibly the Coriolis torques. Based on the reanalysis data plots through September 2nd, global tropospheric relative AAM is ~minus 1 sigma below the 1968-1997 climatology.
A time-latitude section of 200mb zonal mean zonal wind anomalies can give some sense (this is only 1 level verses a zonally and vertically averaged quantity) as to how global relative AAM is being distributed. Loosely, during the past week zonal mean westerly wind anomalies (magnitudes ~10m/s) have dominated the extratropics poleward of 50 degrees of both hemispheres. Weak easterlies have been present across the equatorial and subtropical atmosphere of the Southern Hemisphere and midlatitudes of the Northern Hemisphere. Finally, weak zonal mean westerly wind anomalies are present across the subtropical atmosphere of the Northern Hemisphere. The latter are contributing to a split-flow pattern from the Pacific into North America, and a recent positive AAM tendency along the equator of ~2 Hadleys may have assisted. As anyone can now see, this situation is a mess, and if the reader looks at the plot reference above, my description does not do the complexity justice.
To summarize, I think we have a weather-climate situation consisting of 1) a likely emerging warm event, 2) a convective signal emerging in the Indian Ocean, and 3) mostly noise. We also need to think about the role of the seasonal cycle as transition to boreal autumn approaches, which also adds a huge source of uncertainty.
Signals are simply too weak to “fit in” to the GSDM framework. From spending lots of hours studying animations of various fields, AAM plots, Hovmollers of “everything”, many ensemble prediction schemes, diagnostics from other worldwide meteorological centers, etc., my suspicion would be to see an emergence to GSDM Stage 2 sometime during the next 1-3 weeks. A key observation will be to watch for a rapid increase in the tropical convection from around the date line to near Southeast Asia during the next few weeks (along with a strong positive maximum in AAM tendency).
Initially troughs may amplify across the western USA with a ridge over the Deep South. Should we see a mature GSDM Stage 2 there would be a large amplitude ridge from ~130W into Alaska with an anomalously deep trough across the middle of North America. This would suggest dry/warm for the far western states and a tilt toward cool/wet for roughly the eastern half of the country. I am not going to make any attempt to break down this possibility week by week. Like it or not, this is the reality we are currently dealing with in regard to making any kind of weather forecast in our situation. Confidence is as low as it gets and any useful probabilistic statements must indicate that.
Week 1 (6-12 September 2006): See above. Please see http://www.nhc.noaa.gov/ for the latest tropical cyclone information.
Week 2 (13-19 September 2006): Same as week 1.
Week 3 (20-26 September 2006): Same as week 1.
In general I think we are looking at cooler than normal temperatures with some opportunities
for rainfall through at least week 1 for Southwest Kansas. Afterwards, unclear.
It is unlikely I will be able to do another posting until about the middle of next week (roughly Wednesday, 9/13). Maybe signals will become clearer by then!
Ed Berry
http://www.cdc.noaa.gov/MJO/Predictions/wb2006.pdf
From taking into consideration the interactions of 4 different subseasonal time scales, a sequence of maps depicting a coherent set of repeatable events has been derived for the Northern Hemisphere cold season from November-March. This set is broken up into 4 stages, referred to as GSDM (for Global Synoptic-Dynamic Model) Stages 1-4 in the text of my Blog. Figure 13 in our paper presents a schematic of the GSDM. Ideally it would be advantageous to post our weather-climate discussions with greater frequency to provide additional detail while having a more complete weather-climate record of attribution and prediction. In these discussions I adapt the GSDM for the warm season. Our list of work includes a seasonally adjusted rendition of the GSDM.
Our latest weather-climate discussion dated August 18th, 2006, has been posted on the ESRL/PSD MJO web site at
http://www.cdc.noaa.gov/MJO/Forecasts/climate_discussions.html
Please see past postings for web site links. I am going to discontinue inserting most of them in an effort for brevity. I also need to do the same with these postings.
The distribution of global tropical SSTs have remained fairly persistent during the last couple of weeks. Western Hemisphere tropical Pacific SSTs remain above normal, with weekly mean anomalies (8/20-26) ~plus 1-2C. The largest magnitudes were centered near the equatorial date line and just west of South America, where daily mean anomalies close to plus 3C were observed on September 4th for the latter (seasonal cycle of SSTs contributing). Anomalies of roughly plus .5-1.5C were still present across the Atlantic and much of the Indian Ocean. Below normal SSTs ~minus 1-2C continue around Indonesia, particularly south of the equator. Hence we see a pattern of a “warm Indian Ocean-cool Indonesian region-warm date line region” in regard to SSTAs, typical of a mature warm ENSO event.
Persistent westerly wind anomalies (~3-5 m/s from about 140E-180) and even actual westerlies have continued to deepen the oceanic thermocline along the equatorial cold tongue. In fact, latest TAO buoy data show anomalies ~plus 4C at 100m depth ~140W, and I may be able to make the case for 2 oceanic Kelvin waves currently propagating east along the cold tongue thermocline.
Actual SSTs in excess of 29C (threshold we use to maintain significant tropical convective forcing) remain present across portions of the Indian Ocean, equatorial date line and regions of the Caribbean. These SSTs are most extensive from ~150E-180 within 10 degrees of the equator (see links for details). An important point is SST boundary forcing has been contributing to multiple regions of enhanced tropical convection, with episodic flare-ups particularly across the Indian Ocean and date line areas during the past several weeks. This has masked any real coherent signals of tropical forcing that may still exist, and for all intents and purposes there is no MJO signal, nor any more modes of 30 and 50-day processes. Much of the tropical forcing is random with little organization.
This is interesting since the spatial distribution of global tropical SSTs may not be random, but slowly evolving in a coherent manner. I have a thought that as the seasonal (southward) migration of tropical convection occurs west of the date line; perhaps by the December 2006-January 2007 time frame SST boundary forced convection in the region of the date line may start to dominate. A secondary region may also continue across the Indian Ocean. This evolution would be consistent with the onset of a mature phase of a warm event. Again, I reiterate that I think the atmosphere is tilting toward a warm ENSO event (magnitude unclear), and some indices would offer a weak warm event has already emerged. What I stated above is pure speculation which I cannot defend at this time. The following are links to ENSO discussions.
http://www.cdc.noaa.gov/people/klaus.wolter/MEI/
http://www.cpc.ncep.noaa.gov/products/analysis_monitoring/enso_advisory/index.html
Please also see the following CPC link (and others therein) for further ENSO, etc., insights, and remember that official USA information on anything related to ENSO comes from CPC.
http://www.cpc.ncep.noaa.gov/products/predictions/90day/
From monitoring, I do think this developing situation (possible warm ENSO) has had at least “episodic impacts” to the global weather during boreal summer. These include general suppression (thus far) of the Tropical North Atlantic (TNA) tropical cyclone season (understanding climatology), the increase of Tropical Northwest Pacific (TNWP) tropical cyclones (ex., southeast China), and the excessive heat much of the USA has dealt with.
Obviously weather-climate linkage signals are very weak. There are interactions which are certainly not linear and random that has been occurring for a while, and I only want to summarize the (hopefully) important behaviors for brevity. Right now I think the most robust tropical convective signal is emerging across the equatorial Indian Ocean (OLRA ~ minus 50-70 W/m**2), and I think Rossby wave energy dispersion (RWD) processes moving through the North Atlantic/Scandinavia are contributing. Other regions remain north of the date line, around the Americas and finally the TNA into Africa. Various plots of velocity potential suggest the latter is a convectively coupled dynamical signal which may emerge into the Indian Ocean during the next week or so.
The tropical convection across the Indian Ocean is linked with upper tropospheric westerlies (see animations of 150mb and 250mb daily mean vector wind anomalies), perhaps suggestive of extratropical dynamical forcing. The coherent modes Hovmoller plots suggest a convectively coupled Kevin wave to develop from this enhanced rainfall and move east. My own thought would support that notion, possibly leading to increased enhancement of tropical convection from the date line region toward the Philippines sometime during week 2. Convection may also remain enhanced across the Indian Ocean as the weak dynamical signal comes into the Eastern Hemisphere. Models such as the CDC and NCEP ensemble maintain precipitation across these 2 areas during week 2 largely responding to the SSTs.
Per animations of 150mb and 250mb daily mean vector wind anomalies, around September 2nd nearly symmetric RWDs linked to twin subtropical anticyclones ~120E occurred in both hemispheres. Circulation anomalies were roughly 20-30m/s at 150mb. The Northern Hemisphere version went across the Pacific Rim and lead to the anomalous cyclone that was across the Northern Plains while its counterpart led to a significant cold outbreak across much of South America. This pattern has dispersed, with currently a lot of northeast-southwest tilt (AAM transport signals were still weak 3 days ago per reanalysis data) to the anomalies from Asia to North America. There is a “hint” that the twin anomalous subtropical anticyclones are currently shifting west toward the Indian Ocean convection. Finally I should mention that twin anticyclones (with generally weak anomalies) keep “coming and going” around the equatorial date line region. The latter is likely a warm ENSO signal.
Global AAM signals are much too weak to discuss. There are regions particularly across the Southern Hemisphere where zonal mean contributions are large particularly from the frictional and possibly the Coriolis torques. Based on the reanalysis data plots through September 2nd, global tropospheric relative AAM is ~minus 1 sigma below the 1968-1997 climatology.
A time-latitude section of 200mb zonal mean zonal wind anomalies can give some sense (this is only 1 level verses a zonally and vertically averaged quantity) as to how global relative AAM is being distributed. Loosely, during the past week zonal mean westerly wind anomalies (magnitudes ~10m/s) have dominated the extratropics poleward of 50 degrees of both hemispheres. Weak easterlies have been present across the equatorial and subtropical atmosphere of the Southern Hemisphere and midlatitudes of the Northern Hemisphere. Finally, weak zonal mean westerly wind anomalies are present across the subtropical atmosphere of the Northern Hemisphere. The latter are contributing to a split-flow pattern from the Pacific into North America, and a recent positive AAM tendency along the equator of ~2 Hadleys may have assisted. As anyone can now see, this situation is a mess, and if the reader looks at the plot reference above, my description does not do the complexity justice.
To summarize, I think we have a weather-climate situation consisting of 1) a likely emerging warm event, 2) a convective signal emerging in the Indian Ocean, and 3) mostly noise. We also need to think about the role of the seasonal cycle as transition to boreal autumn approaches, which also adds a huge source of uncertainty.
Signals are simply too weak to “fit in” to the GSDM framework. From spending lots of hours studying animations of various fields, AAM plots, Hovmollers of “everything”, many ensemble prediction schemes, diagnostics from other worldwide meteorological centers, etc., my suspicion would be to see an emergence to GSDM Stage 2 sometime during the next 1-3 weeks. A key observation will be to watch for a rapid increase in the tropical convection from around the date line to near Southeast Asia during the next few weeks (along with a strong positive maximum in AAM tendency).
Initially troughs may amplify across the western USA with a ridge over the Deep South. Should we see a mature GSDM Stage 2 there would be a large amplitude ridge from ~130W into Alaska with an anomalously deep trough across the middle of North America. This would suggest dry/warm for the far western states and a tilt toward cool/wet for roughly the eastern half of the country. I am not going to make any attempt to break down this possibility week by week. Like it or not, this is the reality we are currently dealing with in regard to making any kind of weather forecast in our situation. Confidence is as low as it gets and any useful probabilistic statements must indicate that.
Week 1 (6-12 September 2006): See above. Please see http://www.nhc.noaa.gov/ for the latest tropical cyclone information.
Week 2 (13-19 September 2006): Same as week 1.
Week 3 (20-26 September 2006): Same as week 1.
In general I think we are looking at cooler than normal temperatures with some opportunities
for rainfall through at least week 1 for Southwest Kansas. Afterwards, unclear.
It is unlikely I will be able to do another posting until about the middle of next week (roughly Wednesday, 9/13). Maybe signals will become clearer by then!
Ed Berry
Saturday, August 26, 2006
Next Update ~9/6/2006
As I stated in my last posting, it is unlikely I will be able to do another
discussion until around September 6th. I hope weather-climate signals
will become clearer by then. Right now the atmosphere is behaving
randomly, with some effort to reorganize the tropical convective forcing
back into the Eastern Hemisphere. Perhaps the global circulation is
headed for GSDM Stage 1 in the near future. Stay tuned!!!
Ed Berry
discussion until around September 6th. I hope weather-climate signals
will become clearer by then. Right now the atmosphere is behaving
randomly, with some effort to reorganize the tropical convective forcing
back into the Eastern Hemisphere. Perhaps the global circulation is
headed for GSDM Stage 1 in the near future. Stay tuned!!!
Ed Berry
Wednesday, August 23, 2006
New World Atmosphere Rocks!!!
The following is a link to our recently accepted paper by MWR which discusses the GSDM (Weickmann and Berry 2006).
http://www.cdc.noaa.gov/MJO/Predictions/wb2006.pdf
From taking into consideration the interactions of 4 different subseasonal time scales, a sequence of maps depicting a coherent set of repeatable events has been derived for the Northern Hemisphere cold season from November-March. This set is broken up into 4 stages, referred to as GSDM (for Global Synoptic-Dynamic Model) Stages 1-4 in the text of my Blog. Figure 13 in our paper presents a schematic of the GSDM. Ideally it would be advantageous to post our weather-climate discussions (link at the bottom) with greater frequency to provide additional detail while having a more complete weather-climate record of attribution and prediction. In these discussions I adapt the GSDM for the warm season. Our list of work includes a seasonally adjusted rendition of the GSDM.
Our latest weather-climate discussion dated August 18th, 2006, has been posted on the ESRL/PSD MJO web site at
http://www.cdc.noaa.gov/MJO/Forecasts/climate_discussions.html
Please see past postings for web site links. I am going to discontinue inserting most of them in an effort for brevity. I also need to do the same with these postings.
Western Hemisphere tropical Pacific SSTs remain above normal, with weekly mean anomalies (8/13-19) ~plus 1-1.5C. Somewhat larger anomalies exist just west of South America and from the equatorial date line to about 160E, with magnitudes ~plus 2C. SST anomalies ~plus .5-1.5C were also prevalent across most of the Caribbean and portions of the Tropical North Atlantic (TNA), as well as the Indian Ocean. Actual SSTs in excess of 29C are present across portions of the Indian Ocean, equatorial date line and regions of the Caribbean. Below normal SSTs, with anomalies ~minus .5-1.0C have been observed for a few weeks from ~90-150E particularly just south of the equator around Indonesia to north of Australia. This pattern of cool SSTs near Indonesia with warmth around the date line is typical of mature warm events, not developing ones which may presently be the case.
TAO buoy array and other data continue to tell us of persistent strong westerly wind anomalies (and actual westerlies) on the equator at the date line (anomalies ~5-10m/s), with SSTAs ~plus 2C down to depths of 150m in that region. In fact, there may be 2 downwelling oceanic Kelvin waves moving along the thermocline of the equatorial Pacific cold tongue, with one just east of the date line and the other ~120W. To me, all indications are that the ocean-atmosphere system is tilting toward a warm ENSO event (magnitude unclear), and some indices would offer a weak warm event has already emerged.
The following are links to ENSO discussions.
http://www.cdc.noaa.gov/people/klaus.wolter/MEI/
http://www.cpc.ncep.noaa.gov/products/analysis_monitoring/enso_advisory/index.html
Please also see the following CPC link (and others therein) for further ENSO, etc., insights, and remember that official USA information on anything related to ENSO comes from CPC.
http://www.cpc.ncep.noaa.gov/products/predictions/90day/
From monitoring, I do think this developing situation (possible warm ENSO) has had at least “episodic impacts” the global weather during boreal summer. These include suppression (thus far) of the TNA tropical cyclone season (understanding climatology), the increase of TNWP tropical cyclones (ex., southeast China), and the excessive heat much of the USA has dealt with.
Weather-climate linkage signals particularly from the tropics remain very weak. There is evidence, as would be expected per above, that atmosphere-ocean coupling between the SST boundary forced tropical convection west of the date line and circulation response/feedback has been occurring possibly since April (see recent weather-climate discussion for details). However, the MJO signal is virtually non-existent and even the ~50-day and ~30-day tropical forcing signals are anemic at best. The AAM plots, particularly the tendency and mountain and frictional torques still do give some evidence of the latter. There is a fast convective dynamical signal (weakly projects onto a Kelvin wave per Coherent modes Hovmollers) moving through the Western Hemisphere at ~16-17m/s located at about 40W. It is possible this signal will emerge into the Indian Ocean by the end of week 1, especially since thunderstorm clusters are becoming very active across central Africa.
Per animations of 150mb and 250mb daily mean vector wind anomalies (and other fields) I can offer that the tropical convective flare-up ~August 7-10 at roughly 160E first impacted the extratropics via Rossby wave energy dispersions (and other complex processes), and currently the extratropics may be forcing back into the tropics. For instance, about a week after the flare-up blocking appeared across the North Atlantic which subsequently dispersed into northern Asia and led to a recent anticyclonic wave breaking (AWB) event across the Northwest Pacific. During this whole period anomalous equatorial zonal mean westerly flow collapsed with even weak zonal mean easterlies appearing. Additionally, the AWB has also assisted with AAM transport to allow zonal mean westerly flow (anomalies ~plus 5m/s at 200mb) to propagate poleward to ~25N. There have been at least 2 weather impacts (relevant to the USA): 1) a more favorable environment for TNA tropical cyclogenesis, and 2) enhancement of the southwest USA monsoon.
There may be another important repercussion: extratropical feedbacks into the tropics to further develop a possible oncoming warm event. I can also offer that the above discussed AWB, through extratropical baroclinic processes interacting with dynamical processes in the tropics, have allowed for the persistence and even intensification of the anomalous equatorial westerlies near the date line. All of this is very speculative and needs to quantified for any hope of defensibility. Whatever the case may be, the atmosphere is on a path which is presenting tremendous difficulty to diagnose using “conventional thinking” (not to say things like the above have not happened before; they have).
There are also active tropical convective signals rapidly appearing across both the west central Pacific (which has been a region of recent suppression) and equatorial Indian Ocean. Strong convective suppression still continues from ~80-120E. The recent active signals appear to have had assistance from the Southern Hemisphere extratropics. I would speculate that the Indian Ocean convection may propagate northeast toward the Bay of Bengal and Southeast Asia, possibly consolidating the growing convection across the TNWP during the next few weeks. One could also offer 2 separate areas may persist for “a while” given the SSTs and the fast dynamical signal currently moving through the Western Hemisphere.
To summarize, I think we have a weather-climate situation consisting of 1) a likely emerging warm event, 2) fast Western Hemisphere convectively coupled dynamical signal about to propagate into the Eastern Hemisphere, and 3) a lot of weak unclear speculative signals as discussed above, which is seemingly a situation becoming “the norm”. We also need to think about the role of the seasonal cycle as transition to boreal autumn approaches.
The AAM plots present little global signal. There are strong AAM signals from the Southern Hemisphere particularly from the frictional and Coriolis torques, and earth components contributing to a global relative AAM signal of ~minus ½ sigma. Since about June 1st, zonal mean westerly flow at 200mb has been well above average from 25-40S with anomalies as great as 15-20m/s, allowing for a very active storm track there. The latter may also be a warm ENSO signal.
GSDM Stage 3-4 best describes the current weather-climate situation (considering the AAM budget). Zonal mean anomalous westerly flow is propagating well into northern subtropical atmosphere, while weak zonal mean easterly flow replaces it along the equator. Also, tropical convective forcing across the Eastern Hemisphere appears to be on the increase. I did not expect this situation a week ago. My thoughts were for GSDM Stage 2 at this time, and any I prediction I based on that was a poor assessment. For instance, I had thoughts of a fairly cool airmass for the middle of the USA starting this weekend into next week, and that does not look likely (there will still be a polar Pacific airmass moving into the Plains).
Where we go from here is unclear. Given there are 2 areas of tropical forcing emerging across the Eastern Hemisphere, past experience would tell me GSDM Stage 4-1 for week 1. The ECMWF deterministic run through day 7 supports this notion. Models such as the NCEP GFS 500mb ensemble mean suggest a GSDM Stage 3 like circulation for week 2. My humble thought would be to speculate a convective signal to propagate into the TNWP by the end of week 2 or week 3, perhaps leading to GSDM Stage 2 during that time. Whatever the case, careful daily monitoring within the GSDM framework will be needed to capture the possibility of a significant signal emerging from what is essentially mostly noise.
The numerical models have also been struggling with this situation. While these numerical prediction schemes have little information about the impact of tropical convective forcing after about day 5, they do take into account non-linear feedbacks. My advice to anyone having to make predictions is to consult as many numerical ensemble prediction schemes as possible. That, along with monitoring using the GSDM, should give some hope for success for roughly week 1. Confidence in the following outlooks is as low as it gets. I would feel this way even if there was excellent ensemble numerical model agreement through week 3 since I can point to sources of uncertainty with the GSDM framework that numerical models will struggle with.
Week 1 (24-30 August 2006): GSDM Stage 4-1 may be most probable, meaning a subtropical ridge across the Deep Southeast USA and relatively low amplitude NE-SW trough across the western states. The SW USA monsoon should remain quite active. There may be an active MCS storm track across much of the middle of the country. Flooding from heavy rain producing thunderstorms is a concern for much of the Desert Southwest into the Central Plains. A window of opportunity for tropical cyclogenesis should continue across the TNA. Please see http://www.nhc.noaa.gov/ for the latest tropical cyclone information.
Week 2 (31 August – 6 September 2006): As seasonal transition to stronger westerly flow continues across the country, loosely GSDM Stage 1-2 may occur. That would suggest more mobile troughs coming into the western USA with a subtropical ridge across the Southeast. The Desert Southwest monsoon may start to weaken. Everything else is unclear.
Week 3 (7-13 September 2006): Unclear to offer anything statistically useful to folks who need it.
Another decent episode of rainfall (including a flooding hazard) is probable for Southwest Kansas at least through this upcoming weekend along with near-below normal temperatures. I can see (with my crystal ball) another scenario for a frontal episode of rainfall late next week; however, upper tropospheric moisture transport from the deep tropics may be less by that time. Temperatures may warm to above normal before this. Climatology will start working against us for rainfall as we get into this fall. We will see. I can always dream up scenarios to work against it.
I will try to do another posting this upcoming weekend. I will be on travel from 8/27-9/2, and the next posting may not be until 9/6.
Ed Berry
http://www.cdc.noaa.gov/MJO/Predictions/wb2006.pdf
From taking into consideration the interactions of 4 different subseasonal time scales, a sequence of maps depicting a coherent set of repeatable events has been derived for the Northern Hemisphere cold season from November-March. This set is broken up into 4 stages, referred to as GSDM (for Global Synoptic-Dynamic Model) Stages 1-4 in the text of my Blog. Figure 13 in our paper presents a schematic of the GSDM. Ideally it would be advantageous to post our weather-climate discussions (link at the bottom) with greater frequency to provide additional detail while having a more complete weather-climate record of attribution and prediction. In these discussions I adapt the GSDM for the warm season. Our list of work includes a seasonally adjusted rendition of the GSDM.
Our latest weather-climate discussion dated August 18th, 2006, has been posted on the ESRL/PSD MJO web site at
http://www.cdc.noaa.gov/MJO/Forecasts/climate_discussions.html
Please see past postings for web site links. I am going to discontinue inserting most of them in an effort for brevity. I also need to do the same with these postings.
Western Hemisphere tropical Pacific SSTs remain above normal, with weekly mean anomalies (8/13-19) ~plus 1-1.5C. Somewhat larger anomalies exist just west of South America and from the equatorial date line to about 160E, with magnitudes ~plus 2C. SST anomalies ~plus .5-1.5C were also prevalent across most of the Caribbean and portions of the Tropical North Atlantic (TNA), as well as the Indian Ocean. Actual SSTs in excess of 29C are present across portions of the Indian Ocean, equatorial date line and regions of the Caribbean. Below normal SSTs, with anomalies ~minus .5-1.0C have been observed for a few weeks from ~90-150E particularly just south of the equator around Indonesia to north of Australia. This pattern of cool SSTs near Indonesia with warmth around the date line is typical of mature warm events, not developing ones which may presently be the case.
TAO buoy array and other data continue to tell us of persistent strong westerly wind anomalies (and actual westerlies) on the equator at the date line (anomalies ~5-10m/s), with SSTAs ~plus 2C down to depths of 150m in that region. In fact, there may be 2 downwelling oceanic Kelvin waves moving along the thermocline of the equatorial Pacific cold tongue, with one just east of the date line and the other ~120W. To me, all indications are that the ocean-atmosphere system is tilting toward a warm ENSO event (magnitude unclear), and some indices would offer a weak warm event has already emerged.
The following are links to ENSO discussions.
http://www.cdc.noaa.gov/people/klaus.wolter/MEI/
http://www.cpc.ncep.noaa.gov/products/analysis_monitoring/enso_advisory/index.html
Please also see the following CPC link (and others therein) for further ENSO, etc., insights, and remember that official USA information on anything related to ENSO comes from CPC.
http://www.cpc.ncep.noaa.gov/products/predictions/90day/
From monitoring, I do think this developing situation (possible warm ENSO) has had at least “episodic impacts” the global weather during boreal summer. These include suppression (thus far) of the TNA tropical cyclone season (understanding climatology), the increase of TNWP tropical cyclones (ex., southeast China), and the excessive heat much of the USA has dealt with.
Weather-climate linkage signals particularly from the tropics remain very weak. There is evidence, as would be expected per above, that atmosphere-ocean coupling between the SST boundary forced tropical convection west of the date line and circulation response/feedback has been occurring possibly since April (see recent weather-climate discussion for details). However, the MJO signal is virtually non-existent and even the ~50-day and ~30-day tropical forcing signals are anemic at best. The AAM plots, particularly the tendency and mountain and frictional torques still do give some evidence of the latter. There is a fast convective dynamical signal (weakly projects onto a Kelvin wave per Coherent modes Hovmollers) moving through the Western Hemisphere at ~16-17m/s located at about 40W. It is possible this signal will emerge into the Indian Ocean by the end of week 1, especially since thunderstorm clusters are becoming very active across central Africa.
Per animations of 150mb and 250mb daily mean vector wind anomalies (and other fields) I can offer that the tropical convective flare-up ~August 7-10 at roughly 160E first impacted the extratropics via Rossby wave energy dispersions (and other complex processes), and currently the extratropics may be forcing back into the tropics. For instance, about a week after the flare-up blocking appeared across the North Atlantic which subsequently dispersed into northern Asia and led to a recent anticyclonic wave breaking (AWB) event across the Northwest Pacific. During this whole period anomalous equatorial zonal mean westerly flow collapsed with even weak zonal mean easterlies appearing. Additionally, the AWB has also assisted with AAM transport to allow zonal mean westerly flow (anomalies ~plus 5m/s at 200mb) to propagate poleward to ~25N. There have been at least 2 weather impacts (relevant to the USA): 1) a more favorable environment for TNA tropical cyclogenesis, and 2) enhancement of the southwest USA monsoon.
There may be another important repercussion: extratropical feedbacks into the tropics to further develop a possible oncoming warm event. I can also offer that the above discussed AWB, through extratropical baroclinic processes interacting with dynamical processes in the tropics, have allowed for the persistence and even intensification of the anomalous equatorial westerlies near the date line. All of this is very speculative and needs to quantified for any hope of defensibility. Whatever the case may be, the atmosphere is on a path which is presenting tremendous difficulty to diagnose using “conventional thinking” (not to say things like the above have not happened before; they have).
There are also active tropical convective signals rapidly appearing across both the west central Pacific (which has been a region of recent suppression) and equatorial Indian Ocean. Strong convective suppression still continues from ~80-120E. The recent active signals appear to have had assistance from the Southern Hemisphere extratropics. I would speculate that the Indian Ocean convection may propagate northeast toward the Bay of Bengal and Southeast Asia, possibly consolidating the growing convection across the TNWP during the next few weeks. One could also offer 2 separate areas may persist for “a while” given the SSTs and the fast dynamical signal currently moving through the Western Hemisphere.
To summarize, I think we have a weather-climate situation consisting of 1) a likely emerging warm event, 2) fast Western Hemisphere convectively coupled dynamical signal about to propagate into the Eastern Hemisphere, and 3) a lot of weak unclear speculative signals as discussed above, which is seemingly a situation becoming “the norm”. We also need to think about the role of the seasonal cycle as transition to boreal autumn approaches.
The AAM plots present little global signal. There are strong AAM signals from the Southern Hemisphere particularly from the frictional and Coriolis torques, and earth components contributing to a global relative AAM signal of ~minus ½ sigma. Since about June 1st, zonal mean westerly flow at 200mb has been well above average from 25-40S with anomalies as great as 15-20m/s, allowing for a very active storm track there. The latter may also be a warm ENSO signal.
GSDM Stage 3-4 best describes the current weather-climate situation (considering the AAM budget). Zonal mean anomalous westerly flow is propagating well into northern subtropical atmosphere, while weak zonal mean easterly flow replaces it along the equator. Also, tropical convective forcing across the Eastern Hemisphere appears to be on the increase. I did not expect this situation a week ago. My thoughts were for GSDM Stage 2 at this time, and any I prediction I based on that was a poor assessment. For instance, I had thoughts of a fairly cool airmass for the middle of the USA starting this weekend into next week, and that does not look likely (there will still be a polar Pacific airmass moving into the Plains).
Where we go from here is unclear. Given there are 2 areas of tropical forcing emerging across the Eastern Hemisphere, past experience would tell me GSDM Stage 4-1 for week 1. The ECMWF deterministic run through day 7 supports this notion. Models such as the NCEP GFS 500mb ensemble mean suggest a GSDM Stage 3 like circulation for week 2. My humble thought would be to speculate a convective signal to propagate into the TNWP by the end of week 2 or week 3, perhaps leading to GSDM Stage 2 during that time. Whatever the case, careful daily monitoring within the GSDM framework will be needed to capture the possibility of a significant signal emerging from what is essentially mostly noise.
The numerical models have also been struggling with this situation. While these numerical prediction schemes have little information about the impact of tropical convective forcing after about day 5, they do take into account non-linear feedbacks. My advice to anyone having to make predictions is to consult as many numerical ensemble prediction schemes as possible. That, along with monitoring using the GSDM, should give some hope for success for roughly week 1. Confidence in the following outlooks is as low as it gets. I would feel this way even if there was excellent ensemble numerical model agreement through week 3 since I can point to sources of uncertainty with the GSDM framework that numerical models will struggle with.
Week 1 (24-30 August 2006): GSDM Stage 4-1 may be most probable, meaning a subtropical ridge across the Deep Southeast USA and relatively low amplitude NE-SW trough across the western states. The SW USA monsoon should remain quite active. There may be an active MCS storm track across much of the middle of the country. Flooding from heavy rain producing thunderstorms is a concern for much of the Desert Southwest into the Central Plains. A window of opportunity for tropical cyclogenesis should continue across the TNA. Please see http://www.nhc.noaa.gov/ for the latest tropical cyclone information.
Week 2 (31 August – 6 September 2006): As seasonal transition to stronger westerly flow continues across the country, loosely GSDM Stage 1-2 may occur. That would suggest more mobile troughs coming into the western USA with a subtropical ridge across the Southeast. The Desert Southwest monsoon may start to weaken. Everything else is unclear.
Week 3 (7-13 September 2006): Unclear to offer anything statistically useful to folks who need it.
Another decent episode of rainfall (including a flooding hazard) is probable for Southwest Kansas at least through this upcoming weekend along with near-below normal temperatures. I can see (with my crystal ball) another scenario for a frontal episode of rainfall late next week; however, upper tropospheric moisture transport from the deep tropics may be less by that time. Temperatures may warm to above normal before this. Climatology will start working against us for rainfall as we get into this fall. We will see. I can always dream up scenarios to work against it.
I will try to do another posting this upcoming weekend. I will be on travel from 8/27-9/2, and the next posting may not be until 9/6.
Ed Berry
Tuesday, August 15, 2006
The New World Atmosphere – Update
The following is a link to our recently accepted paper by MWR which discusses the GSDM (Weickmann and Berry 2006).
http://www.cdc.noaa.gov/MJO/Predictions/wb2006.pdf
From taking into consideration the interactions of 4 different subseasonal time scales, a sequence of maps depicting a coherent set of repeatable events has been derived for the Northern Hemisphere cold season from November-March. This set is broken up into 4 stages, referred to as GSDM (for Global Synoptic-Dynamic Model) Stages 1-4 in the text of my Blog. Figure 13 in our paper presents a schematic of the GSDM. Ideally it would be advantageous to post our weather-climate discussions (link at the bottom) with greater frequency to provide additional detail while having a more complete weather-climate record of attribution and prediction. In these discussions I adapt the GSDM for the warm season. Our list of work includes a seasonally adjusted rendition of the GSDM.
Please see previous posting for links. This writing will be very short, and it is unlikely I will do one this weekend due to covering operational shifts and work to get the next weather-climate discussion out for posting on the ESRL/PSD MJO web site. I should be able to do a complete Blog discussion next Wednesday, 8/22. What I posted on August 12th is still quite valid.
Tropical Ocean SSTs remain above average across most of the Western Hemisphere and the Indian Ocean, with cooler than normal values centered on Indonesia. Actual SSTs in excess of 30C have been observed along and just north of the equator ~160E, with 29C and warmer over the TNWP as well as from the East Pacific, Caribbean into the Gulf of Mexico. Latest TAO data suggests the oceanic Kelvin wave is located around 160W, and that surface westerly wind anomalies (~5m/s) have once again returned to the equatorial date line region.
There continues to be little signal of a MJO, and there is some evidence of weak coupling between the tropical convection and warm SSTs west of the date line. An eastward propagating dynamical signal has emerged into the Western Hemisphere, moving along the East Pacific ITCZ as I type (phase speed ~8-10m/s). Finally, consolidation of tropical forcing is taking place centered ~10-15N/110E (including the monsoon systems), with an intense flare-up just north of the equator centered ~60E.
Consistent with previous events during the last several months, I would expect Indian Ocean flare-up to propagate northeast and also merge with the on-going convective activity from India to Southeast Asia. This whole region of enhancement could easily shift into the TNWP weeks 2-3 maintaining the tropical cyclone concern for that region.
While tropical convection should persist west of the date line (SST boundary forcing), general suppression may be the case around Indonesia, all during weeks 1 and 2. The TNWP forcing could easily reinvigorate the SST boundary forced convection west of the dateline afterwards. Finally, the Western Hemisphere dynamical signal may propagate though the Americas into the Atlantic by weeks 2-3, creating a tropical cyclone hazard for the East Pacific and perhaps the North Atlantic later on. The latter will need careful monitoring, especially for hybrids, particularly if the environment of the deep tropical Atlantic remains unfavorable.
Zonal mean westerly wind anomalies to continue to increase from 15S-25N, with magnitudes at 200mb ~5m/s at 15N. Animations of 150mb and 250mb daily mean vector wind anomalies shows the appearance of twin upper tropospheric anticyclones around the date line within the tropics, with distorted twin subtropical anticyclones ~120E. These anticyclones (with lower tropospheric cyclones – baroclinic processes) are the result of the divergent outflows from the tropical forcing discussed above. The pair at the date line is a response the SST boundary forcing (and perhaps an ENSO signal due to an evolving possible warm event; a slower process than subseasonal), and are contributing to the recent increase of zonal mean anomalous westerly flow throughout the tropical and subtropical atmospheres. I can link the large anticyclonic circulation anomaly just southeast of Greenland to at least once recent rapid Rossby wave energy dispersion (RWD) from the date line anticyclones forced by the SSTs. Some of the anomalous westerly flow is already impacting not only the Tropical North Atlantic, but even enhancing moisture transport into the Desert Southwest of the USA (interacting with the extratropics).
GSDM Stage 1-2 best describes the global circulation (see links to AAM plots). A transition to GSDM Stage 2 would be most probable during week 2, possibly persisting into week 3. Afterwards, offering anything statistically useful is unclear. This would suggest retrogression of the ridge back into the Great Basin and perhaps into Alaska, with a central and eastern North American trough. Responding to some of the initial conditions discussed above, most ensemble numerical models support this notion for week 2. However, uncertainty continues extremely high, and I have been suggesting this option for at least 2 weeks (which has not been a total bust). We have been dealing with an atmosphere having somewhat unusual forcing for at least the past few months, and trying to apply “conventional (linear) thinking” to it. For example, trying to apply MJO reasoning to dynamical processes that are not MJO. Expected weather has already been discussed in previous postings.
Ed Berry
http://www.cdc.noaa.gov/MJO/Predictions/wb2006.pdf
From taking into consideration the interactions of 4 different subseasonal time scales, a sequence of maps depicting a coherent set of repeatable events has been derived for the Northern Hemisphere cold season from November-March. This set is broken up into 4 stages, referred to as GSDM (for Global Synoptic-Dynamic Model) Stages 1-4 in the text of my Blog. Figure 13 in our paper presents a schematic of the GSDM. Ideally it would be advantageous to post our weather-climate discussions (link at the bottom) with greater frequency to provide additional detail while having a more complete weather-climate record of attribution and prediction. In these discussions I adapt the GSDM for the warm season. Our list of work includes a seasonally adjusted rendition of the GSDM.
Please see previous posting for links. This writing will be very short, and it is unlikely I will do one this weekend due to covering operational shifts and work to get the next weather-climate discussion out for posting on the ESRL/PSD MJO web site. I should be able to do a complete Blog discussion next Wednesday, 8/22. What I posted on August 12th is still quite valid.
Tropical Ocean SSTs remain above average across most of the Western Hemisphere and the Indian Ocean, with cooler than normal values centered on Indonesia. Actual SSTs in excess of 30C have been observed along and just north of the equator ~160E, with 29C and warmer over the TNWP as well as from the East Pacific, Caribbean into the Gulf of Mexico. Latest TAO data suggests the oceanic Kelvin wave is located around 160W, and that surface westerly wind anomalies (~5m/s) have once again returned to the equatorial date line region.
There continues to be little signal of a MJO, and there is some evidence of weak coupling between the tropical convection and warm SSTs west of the date line. An eastward propagating dynamical signal has emerged into the Western Hemisphere, moving along the East Pacific ITCZ as I type (phase speed ~8-10m/s). Finally, consolidation of tropical forcing is taking place centered ~10-15N/110E (including the monsoon systems), with an intense flare-up just north of the equator centered ~60E.
Consistent with previous events during the last several months, I would expect Indian Ocean flare-up to propagate northeast and also merge with the on-going convective activity from India to Southeast Asia. This whole region of enhancement could easily shift into the TNWP weeks 2-3 maintaining the tropical cyclone concern for that region.
While tropical convection should persist west of the date line (SST boundary forcing), general suppression may be the case around Indonesia, all during weeks 1 and 2. The TNWP forcing could easily reinvigorate the SST boundary forced convection west of the dateline afterwards. Finally, the Western Hemisphere dynamical signal may propagate though the Americas into the Atlantic by weeks 2-3, creating a tropical cyclone hazard for the East Pacific and perhaps the North Atlantic later on. The latter will need careful monitoring, especially for hybrids, particularly if the environment of the deep tropical Atlantic remains unfavorable.
Zonal mean westerly wind anomalies to continue to increase from 15S-25N, with magnitudes at 200mb ~5m/s at 15N. Animations of 150mb and 250mb daily mean vector wind anomalies shows the appearance of twin upper tropospheric anticyclones around the date line within the tropics, with distorted twin subtropical anticyclones ~120E. These anticyclones (with lower tropospheric cyclones – baroclinic processes) are the result of the divergent outflows from the tropical forcing discussed above. The pair at the date line is a response the SST boundary forcing (and perhaps an ENSO signal due to an evolving possible warm event; a slower process than subseasonal), and are contributing to the recent increase of zonal mean anomalous westerly flow throughout the tropical and subtropical atmospheres. I can link the large anticyclonic circulation anomaly just southeast of Greenland to at least once recent rapid Rossby wave energy dispersion (RWD) from the date line anticyclones forced by the SSTs. Some of the anomalous westerly flow is already impacting not only the Tropical North Atlantic, but even enhancing moisture transport into the Desert Southwest of the USA (interacting with the extratropics).
GSDM Stage 1-2 best describes the global circulation (see links to AAM plots). A transition to GSDM Stage 2 would be most probable during week 2, possibly persisting into week 3. Afterwards, offering anything statistically useful is unclear. This would suggest retrogression of the ridge back into the Great Basin and perhaps into Alaska, with a central and eastern North American trough. Responding to some of the initial conditions discussed above, most ensemble numerical models support this notion for week 2. However, uncertainty continues extremely high, and I have been suggesting this option for at least 2 weeks (which has not been a total bust). We have been dealing with an atmosphere having somewhat unusual forcing for at least the past few months, and trying to apply “conventional (linear) thinking” to it. For example, trying to apply MJO reasoning to dynamical processes that are not MJO. Expected weather has already been discussed in previous postings.
Ed Berry
The New World Atmosphere – Update
The following is a link to our recently accepted paper by MWR which discusses the GSDM (Weickmann and Berry 2006).
http://www.cdc.noaa.gov/MJO/Predictions/wb2006.pdf
From taking into consideration the interactions of 4 different subseasonal time scales, a sequence of maps depicting a coherent set of repeatable events has been derived for the Northern Hemisphere cold season from November-March. This set is broken up into 4 stages, referred to as GSDM (for Global Synoptic-Dynamic Model) Stages 1-4 in the text of my Blog. Figure 13 in our paper presents a schematic of the GSDM. Ideally it would be advantageous to post our weather-climate discussions (link at the bottom) with greater frequency to provide additional detail while having a more complete weather-climate record of attribution and prediction. In these discussions I adapt the GSDM for the warm season. Our list of work includes a seasonally adjusted rendition of the GSDM.
Please see previous posting for links. This writing will be very short, and it is unlikely I will do one this weekend due to covering operational shifts and work to get the next weather-climate discussion out for posting on the ESRL/PSD MJO web site. I should be able to do a complete Blog discussion next Wednesday, 8/22. What I posted on August 12th is still quite valid.
Tropical Ocean SSTs remain above average across most of the Western Hemisphere and the Indian Ocean, with cooler than normal values centered on Indonesia. Actual SSTs in excess of 30C have been observed along and just north of the equator ~160E, with 29C and warmer over the TNWP as well as from the East Pacific, Caribbean into the Gulf of Mexico. Latest TAO data suggests the oceanic Kelvin wave is located around 160W, and that surface westerly wind anomalies (~5m/s) have once again returned to the equatorial date line region.
There continues to be little signal of a MJO, and there is some evidence of weak coupling between the tropical convection and warm SSTs west of the date line. An eastward propagating dynamical signal has emerged into the Western Hemisphere, moving along the East Pacific ITCZ as I type (phase speed ~8-10m/s). Finally, consolidation of tropical forcing is taking place centered ~10-15N/110E (including the monsoon systems), with an intense flare-up just north of the equator centered ~60E.
Consistent with previous events during the last several months, I would expect Indian Ocean flare-up to propagate northeast and also merge with the on-going convective activity from India to Southeast Asia. This whole region of enhancement could easily shift into the TNWP weeks 2-3 maintaining the tropical cyclone concern for that region.
While tropical convection should persist west of the date line (SST boundary forcing), general suppression may be the case around Indonesia, all during weeks 1 and 2. The TNWP forcing could easily reinvigorate the SST boundary forced convection west of the dateline afterwards. Finally, the Western Hemisphere dynamical signal may propagate though the Americas into the Atlantic by weeks 2-3, creating a tropical cyclone hazard for the East Pacific and perhaps the North Atlantic later on. The latter will need careful monitoring, especially for hybrids, particularly if the environment of the deep tropical Atlantic remains unfavorable.
Zonal mean westerly wind anomalies to continue to increase from 15S-25N, with magnitudes at 200mb ~5m/s at 15N. Animations of 150mb and 250mb daily mean vector wind anomalies shows the appearance of twin upper tropospheric anticyclones around the date line within the tropics, with distorted twin subtropical anticyclones ~120E. These anticyclones (with lower tropospheric cyclones – baroclinic processes) are the result of the divergent outflows from the tropical forcing discussed above. The pair at the date line is a response the SST boundary forcing (and perhaps an ENSO signal due to an evolving possible warm event; a slower process than subseasonal), and are contributing to the recent increase of zonal mean anomalous westerly flow throughout the tropical and subtropical atmospheres. I can link the large anticyclonic circulation anomaly just southeast of Greenland to at least once recent rapid Rossby wave energy dispersion (RWD) from the date line anticyclones forced by the SSTs. Some of the anomalous westerly flow is already impacting not only the Tropical North Atlantic, but even enhancing moisture transport into the Desert Southwest of the USA (interacting with the extratropics).
GSDM Stage 1-2 best describes the global circulation (see links to AAM plots). A transition to GSDM Stage 2 would be most probable during week 2, possibly persisting into week 3. Afterwards, offering anything statistically useful is unclear. This would suggest retrogression of the ridge back into the Great Basin and perhaps into Alaska, with a central and eastern North American trough. Responding to some of the initial conditions discussed above, most ensemble numerical models support this notion for week 2. However, uncertainty continues extremely high, and I have been suggesting this option for at least 2 weeks (which has not been a total bust). We have been dealing with an atmosphere having somewhat unusual forcing for at least the past few months, and trying to apply “conventional (linear) thinking” to it. For example, trying to apply MJO reasoning to dynamical processes that are not MJO. Expected weather has already been discussed in previous postings.
Ed Berry
http://www.cdc.noaa.gov/MJO/Predictions/wb2006.pdf
From taking into consideration the interactions of 4 different subseasonal time scales, a sequence of maps depicting a coherent set of repeatable events has been derived for the Northern Hemisphere cold season from November-March. This set is broken up into 4 stages, referred to as GSDM (for Global Synoptic-Dynamic Model) Stages 1-4 in the text of my Blog. Figure 13 in our paper presents a schematic of the GSDM. Ideally it would be advantageous to post our weather-climate discussions (link at the bottom) with greater frequency to provide additional detail while having a more complete weather-climate record of attribution and prediction. In these discussions I adapt the GSDM for the warm season. Our list of work includes a seasonally adjusted rendition of the GSDM.
Please see previous posting for links. This writing will be very short, and it is unlikely I will do one this weekend due to covering operational shifts and work to get the next weather-climate discussion out for posting on the ESRL/PSD MJO web site. I should be able to do a complete Blog discussion next Wednesday, 8/22. What I posted on August 12th is still quite valid.
Tropical Ocean SSTs remain above average across most of the Western Hemisphere and the Indian Ocean, with cooler than normal values centered on Indonesia. Actual SSTs in excess of 30C have been observed along and just north of the equator ~160E, with 29C and warmer over the TNWP as well as from the East Pacific, Caribbean into the Gulf of Mexico. Latest TAO data suggests the oceanic Kelvin wave is located around 160W, and that surface westerly wind anomalies (~5m/s) have once again returned to the equatorial date line region.
There continues to be little signal of a MJO, and there is some evidence of weak coupling between the tropical convection and warm SSTs west of the date line. An eastward propagating dynamical signal has emerged into the Western Hemisphere, moving along the East Pacific ITCZ as I type (phase speed ~8-10m/s). Finally, consolidation of tropical forcing is taking place centered ~10-15N/110E (including the monsoon systems), with an intense flare-up just north of the equator centered ~60E.
Consistent with previous events during the last several months, I would expect Indian Ocean flare-up to propagate northeast and also merge with the on-going convective activity from India to Southeast Asia. This whole region of enhancement could easily shift into the TNWP weeks 2-3 maintaining the tropical cyclone concern for that region.
While tropical convection should persist west of the date line (SST boundary forcing), general suppression may be the case around Indonesia, all during weeks 1 and 2. The TNWP forcing could easily reinvigorate the SST boundary forced convection west of the dateline afterwards. Finally, the Western Hemisphere dynamical signal may propagate though the Americas into the Atlantic by weeks 2-3, creating a tropical cyclone hazard for the East Pacific and perhaps the North Atlantic later on. The latter will need careful monitoring, especially for hybrids, particularly if the environment of the deep tropical Atlantic remains unfavorable.
Zonal mean westerly wind anomalies to continue to increase from 15S-25N, with magnitudes at 200mb ~5m/s at 15N. Animations of 150mb and 250mb daily mean vector wind anomalies shows the appearance of twin upper tropospheric anticyclones around the date line within the tropics, with distorted twin subtropical anticyclones ~120E. These anticyclones (with lower tropospheric cyclones – baroclinic processes) are the result of the divergent outflows from the tropical forcing discussed above. The pair at the date line is a response the SST boundary forcing (and perhaps an ENSO signal due to an evolving possible warm event; a slower process than subseasonal), and are contributing to the recent increase of zonal mean anomalous westerly flow throughout the tropical and subtropical atmospheres. I can link the large anticyclonic circulation anomaly just southeast of Greenland to at least once recent rapid Rossby wave energy dispersion (RWD) from the date line anticyclones forced by the SSTs. Some of the anomalous westerly flow is already impacting not only the Tropical North Atlantic, but even enhancing moisture transport into the Desert Southwest of the USA (interacting with the extratropics).
GSDM Stage 1-2 best describes the global circulation (see links to AAM plots). A transition to GSDM Stage 2 would be most probable during week 2, possibly persisting into week 3. Afterwards, offering anything statistically useful is unclear. This would suggest retrogression of the ridge back into the Great Basin and perhaps into Alaska, with a central and eastern North American trough. Responding to some of the initial conditions discussed above, most ensemble numerical models support this notion for week 2. However, uncertainty continues extremely high, and I have been suggesting this option for at least 2 weeks (which has not been a total bust). We have been dealing with an atmosphere having somewhat unusual forcing for at least the past few months, and trying to apply “conventional (linear) thinking” to it. For example, trying to apply MJO reasoning to dynamical processes that are not MJO. Expected weather has already been discussed in previous postings.
Ed Berry
Saturday, August 12, 2006
The New World Atmosphere
The following is a link to our recently accepted paper by MWR which discusses the GSDM (Weickmann and Berry 2006).
http://www.cdc.noaa.gov/MJO/Predictions/wb2006.pdf
From taking into consideration the interactions of 4 different subseasonal time scales, a sequence of maps depicting a coherent set of repeatable events has been derived for the Northern Hemisphere cold season from November-March. This set is broken up into 4 stages, referred to as GSDM (for Global Synoptic-Dynamic Model) Stages 1-4 in the text of my Blog. Figure 13 in our paper presents a schematic of the GSDM. Ideally it would be advantageous to post our weather-climate discussions (link at the bottom) with greater frequency to provide additional detail while having a more complete weather-climate record of attribution and prediction. In these discussions I adapt the GSDM for the warm season. Our list of work includes a seasonally adjusted rendition of the GSDM.
There has been little change in the global tropical SSTs since my August 9th posting. Latest TAO data suggests the third (weak) downwelling oceanic Kelvin wave since mid-March was located around 165W based on the latest five-day averaged TAO data (link below). This feature was accompanied with SSTAs ~plus 1-2C down to about 100m.
The trades have increased across a good portion of the north tropical oceans during the last week, particularly across the Western Hemisphere. This includes the trade wind surge across the central and eastern equatorial Pacific. Surface easterly wind anomalies have been ~3 m/s, and have led to some reduction of the anomalous warmth across the central Pacific. There are still pockets of surface westerly wind anomalies from near the date line into Indonesia. In direct response to a recent consolidation of tropical convective forcing ~10-15N/120E, the Eastern Hemisphere monsoon systems have intensified (more said below). In fact, loosely surface cross-equatorial anomalous southerly flow generally exists from Africa to the date line, with magnitudes of ~5-10m/s. The recent (and expected) upsurge in tropical cyclone activity across the TNWP has contributed this cross-equatorial flow.
Additional global SST information can be obtained from latest TAO data here, ESRL/PSD data here, CPC data
http://www.cpc.ncep.noaa.gov/products/predictions/threats/index_gloss.html,
and BMRC at
http://www.bom.gov.au/bmrc/ocean/results/climocan.htm .
From continuous monitoring and various diagnostic and dynamical tools, there continues to be evidence that the weather-climate system is still tilting toward a warm event. The current trade wind surge discussed above has dampened some of the positive SSTAs associated with it. The following are links to recently updated and informative ENSO discussions.
http://www.cdc.noaa.gov/people/klaus.wolter/MEI/
http://www.cpc.ncep.noaa.gov/products/analysis_monitoring/enso_advisory/index.html
To me, it is unclear what the magnitude of any possible warm event may be, including global impacts. I should also point out that the various modes of subseasonal variability (addressed in this Blog and part of the GSDM) which can initiate slower processes such as a warm event constantly impact the atmosphere in terms of forcing-circulation response and feedbacks. The latter includes extreme weather events.
Please also see the following CPC link (and others therein) for further ENSO, etc., insights, and remember that official USA information on anything related to ENSO comes from CPC.
http://www.cpc.ncep.noaa.gov/products/predictions/90day/
Details of consolidations and other behaviors of tropical forcing have been presented in previous writings and will not be repeated. Per 3-day OLRA plots, tropical forcing remains very intense from ~120E-170E at about 10-15N with magnitudes ~minus 50-90 W/m**2. Enhanced tropical convection is also spreading into the Western Hemisphere to about 150W, while the East Pacific ITCZ becomes more active. There is also another flare-up occurring along the equator in the western Indian Ocean (~40E), possibly related to dynamic forcing from the Southern Hemisphere. The latter is not the “first time” this has occurred during summer 2006. In fact, the latest 30-day OLRA plots show negative anomalies of ~15-25W/m**2 in this region (with suppression of ~plus 50-70 W/m**2 from the central equatorial Indian Ocean into Indonesia – see plots). These features have been propagating fairly rapidly north only to enhance the monsoon systems. What will this latest episode do???
I have not addressed a mode of tropical convective variability in these writings which may have been obvious to many others. Since roughly mid-late April 2006, there has been ~50-60 day enhancement of tropical convective forcing across the west central and TNWP, centered ~160E. After late April, there was enhancement during late June and also right now, with suppression during May and July. The weather-climate discussion we are working on will go into additional detail.
The AAM plots have shown a fairly clean atmospheric response signal to this ~50-60 day tropical convective mode. I should emphasize there are a whole spectrum of processes always going on in the atmosphere. The reasons why this ~50-60 day variability appeared are unclear to me. These may be a natural response to the many other faster dynamical processes I have been talking about in the presence little or no MJO and an emerging warm event. I do not know if these ~50-60 days modes are oscillatory, stationary, something purely stochastic, etc. Whatever the case, it is there and is a concern for attribution and prediction.
I can really make things even more “messy” by offering the tropical convective forcing we are now seeing coming into the Western Hemisphere may be our 30-day mode propagating east while the Indian Ocean flare-up may evolve into another convectively coupled Kelvin wave (and I am just getting started!). This is why disciplined monitoring every day is critical with the GSDM framework to have any hope of mitigating “weather surprises”. In the week 1-3 outlooks I will offer, I am going to focus of the ~50-60 day western Pacific tropical convective forcing signal. Even though my uncertainty will remain tremendously high, I do have slightly better confidence for weeks 1-3 than previously.
Please see http://www.npmoc.navy.mil/jtwc.html and http://www.nhc.noaa.gov/ for tropical cyclone concerns. Empirical, statistical and numerical prediction tools continue to be inconclusive for useful information about the future evolution of the tropical convection, and that is not going to change for the foreseeable future (bravely spoken!). Please see ESRL/PSD MJO tools , BMRC MJO tools, CPC MJO tools, and http://www.cpc.ncep.noaa.gov/products/precip/CWlink/MJO/index.primjo.html for the details. These tools generally rely on a moderate to strong MJO signal, which is nearly non-existent at this time.
However, I think it is worthwhile to again note that the Wheeler index did have a ~1 sigma signal for about a couple of days last week, centered on Southeast Asia and the TNWP (see link), not inconsistent with the above and tropical wind fields (discussed below).
http://www.bom.gov.au/bmrc/clfor/cfstaff/matw/maproom/RMM/phase.Last90days.gif.
There has not been much change to the distribution of 200mb zonal mean zonal wind anomalies since August 9th. There has been a slight increase in the magnitude of anomalous westerly flow ~ 15N with magnitudes ~5m/s (plots can be generated at http://www.cdc.noaa.gov/map/time_plot ; see for yourself some of the details).
If the reader generates a time-latitude section of 150mb zonal mean meridional wind anomalies since April 1st, 2006, a loose relationship between increased zonal mean divergence of ~3 m/s and enhanced convection across centered ~140E can been seen, following the ~50-60 time scale. Of course, this enhanced divergence will shift northward with the seasonal cycle, and may suggest a local increase in the Hadley Cell. The latter may be true at this time.
Global AAM signals are relatively weak, and links are given to the plots. However, I want to make the point that the global frictional torque is already at ~plus 10 Hadleys above the 1968-1997 reanalysis climatology as of August 9th, with a large contribution from the above normal trades. I think we are going to see behaviors similar to roughly April into early May and mid-late June into early July meaning another strong positive phase of a global (remember) mountain-frictional torque index cycle linked to the ~50-60 day tropical convective mode. Recall that the global frictional torque leads the mountain torque by ~6 days.
Animations of 150mb and 250mb daily mean vector wind anomalies still depict loose twin subtropical anticyclones centered around 120-140E in a region of anomalous divergence. Westerly wind anomalies ~15-25m/s continue to be present throughout much of the tropical Pacific into Northern South America, while anomalous easterly flow slowly collapses from the Indian Ocean into Africa. I might also mention that I can link the recent appearance of the large anticyclonic circulation gyre just southeast of Greenland to a recent fast Rossby wave energy dispersion (RWD) initiated by our 30-day convective mode (is that what it is?) crossing the date line into the Western Hemisphere.
To summarize, I think we have a weather-climate situation consisting of 1) the ~50-60 day tropical convective mode, 2) the ~30-day convective mode, 3) other faster modes of tropical convective variability like those caused by the Southern Hemisphere which are nothing but noise, 4) the ~50-day mountain-frictional torque index cycle going perhaps into a positive phase, 5) the rapid extratropical Rossby wave energy dispersions/baroclinic wave packets, 6) weak or non-existent MJO, which may be part of a “new world atmosphere” emerging (I need to add some “strange humor”), 7) possible ENSO and/or global warming signal, and 8) seasonal transition into boreal autumn. The latter includes the strengthening Northern Hemisphere polar vortex, which should displace toward the TNWP convective forcing initially. Restating, I can list a lot of components within our GSDM framework; however, it still all adds up to a weak predictive signal at best.
GSDM Stage 1-2 best describes the current global circulation/weather-climate situation. My thoughts are about another week or so of this situation, with an evolution to GSDM Stage 2 weeks 2-3. Understanding seasonal transition, if there is any truth to our ~50-60 day mode remaining coherent, weeks 3-4 may see a transition to GSDM Stage 3-4, possible evolving to GSDM 4-1 weeks 4-6. Of course, this timing is not statistically useful (noise), but is offered out of concern for the North Atlantic hurricane season. From the subseasonal viewpoint, a scenario of conditions becoming favorable for North Atlantic tropical cyclogenesis as the climatological peak approaches must be monitored.
Week 1 (13-19 August 2006): GSDM Stage 1-2 seems probable. Per the NCEP GFS and other models, there look to be at least 1 or 2 more mobile troughs to dig along the USA west coast, then move inland through the northern states. This would suggest additional episodes of heat to expand from the Central Rockies into much of the Central/Southern Plains and Deep South. An active severe local storm/MCS track would be possible from the Northern/Central Rockies into the Mid/Upper Mississippi Valley/Great Lakes-Ohio Valley. While tropical cyclogenesis may become active across the East Pacific while the TNWP remains quite active, the Atlantic should remain suppressed.
Week 2 (20-26 August 2006): Transition to GSDM 2 would be expected, which means synoptically I may finally see the ridge shift back into the western USA. A downstream central and eastern states trough would be expected. Many models responding to initial conditions are supportive. The anticyclone developing just south of Greenland could shift toward the west, and may contribute an extended period of a negative NAO (I can talk indices too!). The NAO is already negative linked to the flare-up discussed above. While the western states warms/dries, the central and east would be expected to become cooler and wetter. Tropical cyclone development across the North Atlantic may remain suppressed while the East Pacific may be active.
Week 3 (27 August – 2 September 2006): GSDM Stage 2 may mature, perhaps transitioning to GSDM Stage 3. Synoptically this could be a period similar to late June (West Coast ridge maybe into AK, Mississippi Valley/Plains trough, etc.) understanding the seasonal cycle, with the expected weather.
I hope Southwest Kansas can get some much needed rainfall week 1. Timing of fronts with the diurnal cycle of thunderstorm activity has been just one of many factors not favorable for rainfall this summer. I can see this same scenario for portions of this area on Sunday, August 13th. Hopefully the dynamics with the mobile troughs will mitigate some of that. Weeks 2-3 are unclear given our climate sensitivity, especially if the ridge retrogrades. Broadly I would expect a dry regime as the ridge shifts back toward the West Coast while temperatures remain near-above average. At some point a decent surge of cooler than normal air may be possible as Labor Day approaches. To improve our rain chances we need the westerlies farther south with a trough position across the central Rockies (there are other favorable patterns).
The time -filtered coherent modes Hovmoller plots of OLR and OLRA are at http://www.cdc.noaa.gov/map/clim/olr_modes/), velocity potential Hovmollers at http://www.cpc.ncep.noaa.gov/products/intraseasonal/vpot_tlon.html , and an animation of velocity potential overlayed on OLRAs are at http://www.cpc.ncep.noaa.gov/products/precip/CWlink/ir_anim_monthly.shtml.
Satellite imagery and other information can be found from the following links: eastern hemisphere, full-disk west Pacific, mtsat, IO, Africa, http://www.jma.go.jp/en/gms/ ; other imagery here. Latest tropical cyclone statements can be found from http://www.nhc.noaa.gov/, while the latest 3-day averages of OLR totals and anomalies and other data can be found here
http://www.cdc.noaa.gov/map/clim/glbcir.anim.shtml (animations of various fields from the operational data)
http://www.cpc.ncep.noaa.gov/products/precip/CWlink/MJO/mjo.shtml (Global Tropical Hazards Assessment available from this site, along with other useful information)
http://www.cdc.noaa.gov/map/clim/aam.rean.shtml (reanalysis AAM plots)
http://www.cdc.noaa.gov/map/clim/aam.shtml (operational AAM plots)
Latest CDC Ensemble Forecast
Latest NCEP Ensemble Forecast
Additional NCEP Ensemble Output
Latest Canadian Ensemble Output
Latest Deterministic ECMWF Forecasts
http://www.cdc.noaa.gov/people/jeffrey.s.whitaker/refcst/week2/
http://www.cdc.noaa.gov/MJO/Forecasts/climate_discussions.html (link to our Weather-
Climate discussions)
http://www.cpc.ncep.noaa.gov/schemm/z500ac_wk2_na.html (model performance; please navigate to others)
Please see the CPC Drought Monitor for areas of dryness and the latest official outlooks and statements from the Storm Prediction Center not only for severe storms, but also fire weather concerns. Finally, the CPC USA Hazards Assessment for offers additional insights not only for possible week 1 high impact weather, but week 2 as well.
I will try to do another posting around Tuesday, next week. Work is also on-going to post a weather-climate discussion on the ESRL/PSD MJO web site hopefully by about the middle of this month. Due to shift work obligations (graveyards), my next couple of postings may be quite brief, with the possibility of missing next weekend.
Ed Berry
http://www.cdc.noaa.gov/MJO/Predictions/wb2006.pdf
From taking into consideration the interactions of 4 different subseasonal time scales, a sequence of maps depicting a coherent set of repeatable events has been derived for the Northern Hemisphere cold season from November-March. This set is broken up into 4 stages, referred to as GSDM (for Global Synoptic-Dynamic Model) Stages 1-4 in the text of my Blog. Figure 13 in our paper presents a schematic of the GSDM. Ideally it would be advantageous to post our weather-climate discussions (link at the bottom) with greater frequency to provide additional detail while having a more complete weather-climate record of attribution and prediction. In these discussions I adapt the GSDM for the warm season. Our list of work includes a seasonally adjusted rendition of the GSDM.
There has been little change in the global tropical SSTs since my August 9th posting. Latest TAO data suggests the third (weak) downwelling oceanic Kelvin wave since mid-March was located around 165W based on the latest five-day averaged TAO data (link below). This feature was accompanied with SSTAs ~plus 1-2C down to about 100m.
The trades have increased across a good portion of the north tropical oceans during the last week, particularly across the Western Hemisphere. This includes the trade wind surge across the central and eastern equatorial Pacific. Surface easterly wind anomalies have been ~3 m/s, and have led to some reduction of the anomalous warmth across the central Pacific. There are still pockets of surface westerly wind anomalies from near the date line into Indonesia. In direct response to a recent consolidation of tropical convective forcing ~10-15N/120E, the Eastern Hemisphere monsoon systems have intensified (more said below). In fact, loosely surface cross-equatorial anomalous southerly flow generally exists from Africa to the date line, with magnitudes of ~5-10m/s. The recent (and expected) upsurge in tropical cyclone activity across the TNWP has contributed this cross-equatorial flow.
Additional global SST information can be obtained from latest TAO data here, ESRL/PSD data here, CPC data
http://www.cpc.ncep.noaa.gov/products/predictions/threats/index_gloss.html,
and BMRC at
http://www.bom.gov.au/bmrc/ocean/results/climocan.htm .
From continuous monitoring and various diagnostic and dynamical tools, there continues to be evidence that the weather-climate system is still tilting toward a warm event. The current trade wind surge discussed above has dampened some of the positive SSTAs associated with it. The following are links to recently updated and informative ENSO discussions.
http://www.cdc.noaa.gov/people/klaus.wolter/MEI/
http://www.cpc.ncep.noaa.gov/products/analysis_monitoring/enso_advisory/index.html
To me, it is unclear what the magnitude of any possible warm event may be, including global impacts. I should also point out that the various modes of subseasonal variability (addressed in this Blog and part of the GSDM) which can initiate slower processes such as a warm event constantly impact the atmosphere in terms of forcing-circulation response and feedbacks. The latter includes extreme weather events.
Please also see the following CPC link (and others therein) for further ENSO, etc., insights, and remember that official USA information on anything related to ENSO comes from CPC.
http://www.cpc.ncep.noaa.gov/products/predictions/90day/
Details of consolidations and other behaviors of tropical forcing have been presented in previous writings and will not be repeated. Per 3-day OLRA plots, tropical forcing remains very intense from ~120E-170E at about 10-15N with magnitudes ~minus 50-90 W/m**2. Enhanced tropical convection is also spreading into the Western Hemisphere to about 150W, while the East Pacific ITCZ becomes more active. There is also another flare-up occurring along the equator in the western Indian Ocean (~40E), possibly related to dynamic forcing from the Southern Hemisphere. The latter is not the “first time” this has occurred during summer 2006. In fact, the latest 30-day OLRA plots show negative anomalies of ~15-25W/m**2 in this region (with suppression of ~plus 50-70 W/m**2 from the central equatorial Indian Ocean into Indonesia – see plots). These features have been propagating fairly rapidly north only to enhance the monsoon systems. What will this latest episode do???
I have not addressed a mode of tropical convective variability in these writings which may have been obvious to many others. Since roughly mid-late April 2006, there has been ~50-60 day enhancement of tropical convective forcing across the west central and TNWP, centered ~160E. After late April, there was enhancement during late June and also right now, with suppression during May and July. The weather-climate discussion we are working on will go into additional detail.
The AAM plots have shown a fairly clean atmospheric response signal to this ~50-60 day tropical convective mode. I should emphasize there are a whole spectrum of processes always going on in the atmosphere. The reasons why this ~50-60 day variability appeared are unclear to me. These may be a natural response to the many other faster dynamical processes I have been talking about in the presence little or no MJO and an emerging warm event. I do not know if these ~50-60 days modes are oscillatory, stationary, something purely stochastic, etc. Whatever the case, it is there and is a concern for attribution and prediction.
I can really make things even more “messy” by offering the tropical convective forcing we are now seeing coming into the Western Hemisphere may be our 30-day mode propagating east while the Indian Ocean flare-up may evolve into another convectively coupled Kelvin wave (and I am just getting started!). This is why disciplined monitoring every day is critical with the GSDM framework to have any hope of mitigating “weather surprises”. In the week 1-3 outlooks I will offer, I am going to focus of the ~50-60 day western Pacific tropical convective forcing signal. Even though my uncertainty will remain tremendously high, I do have slightly better confidence for weeks 1-3 than previously.
Please see http://www.npmoc.navy.mil/jtwc.html and http://www.nhc.noaa.gov/ for tropical cyclone concerns. Empirical, statistical and numerical prediction tools continue to be inconclusive for useful information about the future evolution of the tropical convection, and that is not going to change for the foreseeable future (bravely spoken!). Please see ESRL/PSD MJO tools , BMRC MJO tools, CPC MJO tools, and http://www.cpc.ncep.noaa.gov/products/precip/CWlink/MJO/index.primjo.html for the details. These tools generally rely on a moderate to strong MJO signal, which is nearly non-existent at this time.
However, I think it is worthwhile to again note that the Wheeler index did have a ~1 sigma signal for about a couple of days last week, centered on Southeast Asia and the TNWP (see link), not inconsistent with the above and tropical wind fields (discussed below).
http://www.bom.gov.au/bmrc/clfor/cfstaff/matw/maproom/RMM/phase.Last90days.gif.

There has not been much change to the distribution of 200mb zonal mean zonal wind anomalies since August 9th. There has been a slight increase in the magnitude of anomalous westerly flow ~ 15N with magnitudes ~5m/s (plots can be generated at http://www.cdc.noaa.gov/map/time_plot ; see for yourself some of the details).
If the reader generates a time-latitude section of 150mb zonal mean meridional wind anomalies since April 1st, 2006, a loose relationship between increased zonal mean divergence of ~3 m/s and enhanced convection across centered ~140E can been seen, following the ~50-60 time scale. Of course, this enhanced divergence will shift northward with the seasonal cycle, and may suggest a local increase in the Hadley Cell. The latter may be true at this time.
Global AAM signals are relatively weak, and links are given to the plots. However, I want to make the point that the global frictional torque is already at ~plus 10 Hadleys above the 1968-1997 reanalysis climatology as of August 9th, with a large contribution from the above normal trades. I think we are going to see behaviors similar to roughly April into early May and mid-late June into early July meaning another strong positive phase of a global (remember) mountain-frictional torque index cycle linked to the ~50-60 day tropical convective mode. Recall that the global frictional torque leads the mountain torque by ~6 days.
Animations of 150mb and 250mb daily mean vector wind anomalies still depict loose twin subtropical anticyclones centered around 120-140E in a region of anomalous divergence. Westerly wind anomalies ~15-25m/s continue to be present throughout much of the tropical Pacific into Northern South America, while anomalous easterly flow slowly collapses from the Indian Ocean into Africa. I might also mention that I can link the recent appearance of the large anticyclonic circulation gyre just southeast of Greenland to a recent fast Rossby wave energy dispersion (RWD) initiated by our 30-day convective mode (is that what it is?) crossing the date line into the Western Hemisphere.
To summarize, I think we have a weather-climate situation consisting of 1) the ~50-60 day tropical convective mode, 2) the ~30-day convective mode, 3) other faster modes of tropical convective variability like those caused by the Southern Hemisphere which are nothing but noise, 4) the ~50-day mountain-frictional torque index cycle going perhaps into a positive phase, 5) the rapid extratropical Rossby wave energy dispersions/baroclinic wave packets, 6) weak or non-existent MJO, which may be part of a “new world atmosphere” emerging (I need to add some “strange humor”), 7) possible ENSO and/or global warming signal, and 8) seasonal transition into boreal autumn. The latter includes the strengthening Northern Hemisphere polar vortex, which should displace toward the TNWP convective forcing initially. Restating, I can list a lot of components within our GSDM framework; however, it still all adds up to a weak predictive signal at best.
GSDM Stage 1-2 best describes the current global circulation/weather-climate situation. My thoughts are about another week or so of this situation, with an evolution to GSDM Stage 2 weeks 2-3. Understanding seasonal transition, if there is any truth to our ~50-60 day mode remaining coherent, weeks 3-4 may see a transition to GSDM Stage 3-4, possible evolving to GSDM 4-1 weeks 4-6. Of course, this timing is not statistically useful (noise), but is offered out of concern for the North Atlantic hurricane season. From the subseasonal viewpoint, a scenario of conditions becoming favorable for North Atlantic tropical cyclogenesis as the climatological peak approaches must be monitored.
Week 1 (13-19 August 2006): GSDM Stage 1-2 seems probable. Per the NCEP GFS and other models, there look to be at least 1 or 2 more mobile troughs to dig along the USA west coast, then move inland through the northern states. This would suggest additional episodes of heat to expand from the Central Rockies into much of the Central/Southern Plains and Deep South. An active severe local storm/MCS track would be possible from the Northern/Central Rockies into the Mid/Upper Mississippi Valley/Great Lakes-Ohio Valley. While tropical cyclogenesis may become active across the East Pacific while the TNWP remains quite active, the Atlantic should remain suppressed.
Week 2 (20-26 August 2006): Transition to GSDM 2 would be expected, which means synoptically I may finally see the ridge shift back into the western USA. A downstream central and eastern states trough would be expected. Many models responding to initial conditions are supportive. The anticyclone developing just south of Greenland could shift toward the west, and may contribute an extended period of a negative NAO (I can talk indices too!). The NAO is already negative linked to the flare-up discussed above. While the western states warms/dries, the central and east would be expected to become cooler and wetter. Tropical cyclone development across the North Atlantic may remain suppressed while the East Pacific may be active.
Week 3 (27 August – 2 September 2006): GSDM Stage 2 may mature, perhaps transitioning to GSDM Stage 3. Synoptically this could be a period similar to late June (West Coast ridge maybe into AK, Mississippi Valley/Plains trough, etc.) understanding the seasonal cycle, with the expected weather.
I hope Southwest Kansas can get some much needed rainfall week 1. Timing of fronts with the diurnal cycle of thunderstorm activity has been just one of many factors not favorable for rainfall this summer. I can see this same scenario for portions of this area on Sunday, August 13th. Hopefully the dynamics with the mobile troughs will mitigate some of that. Weeks 2-3 are unclear given our climate sensitivity, especially if the ridge retrogrades. Broadly I would expect a dry regime as the ridge shifts back toward the West Coast while temperatures remain near-above average. At some point a decent surge of cooler than normal air may be possible as Labor Day approaches. To improve our rain chances we need the westerlies farther south with a trough position across the central Rockies (there are other favorable patterns).
The time -filtered coherent modes Hovmoller plots of OLR and OLRA are at http://www.cdc.noaa.gov/map/clim/olr_modes/), velocity potential Hovmollers at http://www.cpc.ncep.noaa.gov/products/intraseasonal/vpot_tlon.html , and an animation of velocity potential overlayed on OLRAs are at http://www.cpc.ncep.noaa.gov/products/precip/CWlink/ir_anim_monthly.shtml.
Satellite imagery and other information can be found from the following links: eastern hemisphere, full-disk west Pacific, mtsat, IO, Africa, http://www.jma.go.jp/en/gms/ ; other imagery here. Latest tropical cyclone statements can be found from http://www.nhc.noaa.gov/, while the latest 3-day averages of OLR totals and anomalies and other data can be found here
http://www.cdc.noaa.gov/map/clim/glbcir.anim.shtml (animations of various fields from the operational data)
http://www.cpc.ncep.noaa.gov/products/precip/CWlink/MJO/mjo.shtml (Global Tropical Hazards Assessment available from this site, along with other useful information)
http://www.cdc.noaa.gov/map/clim/aam.rean.shtml (reanalysis AAM plots)
http://www.cdc.noaa.gov/map/clim/aam.shtml (operational AAM plots)
Latest CDC Ensemble Forecast
Latest NCEP Ensemble Forecast
Additional NCEP Ensemble Output
Latest Canadian Ensemble Output
Latest Deterministic ECMWF Forecasts
http://www.cdc.noaa.gov/people/jeffrey.s.whitaker/refcst/week2/
http://www.cdc.noaa.gov/MJO/Forecasts/climate_discussions.html (link to our Weather-
Climate discussions)
http://www.cpc.ncep.noaa.gov/schemm/z500ac_wk2_na.html (model performance; please navigate to others)
Please see the CPC Drought Monitor for areas of dryness and the latest official outlooks and statements from the Storm Prediction Center not only for severe storms, but also fire weather concerns. Finally, the CPC USA Hazards Assessment for offers additional insights not only for possible week 1 high impact weather, but week 2 as well.
I will try to do another posting around Tuesday, next week. Work is also on-going to post a weather-climate discussion on the ESRL/PSD MJO web site hopefully by about the middle of this month. Due to shift work obligations (graveyards), my next couple of postings may be quite brief, with the possibility of missing next weekend.
Ed Berry
Wednesday, August 09, 2006
You Tell Me!!!
The following is a link to our recently accepted paper by MWR which discusses the GSDM (Weickmann and Berry 2006).
http://www.cdc.noaa.gov/MJO/Predictions/wb2006.pdf
From taking into consideration the interactions of 4 different subseasonal time scales, a sequence of maps depicting a coherent set of repeatable events has been derived for the Northern Hemisphere cold season from November-March. This set is broken up into 4 stages, referred to as GSDM (for Global Synoptic-Dynamic Model) Stages 1-4 in the text of my Blog. Figure 13 in our paper presents a schematic of the GSDM. Ideally it would be advantageous to post our weather-climate discussions (link at the bottom) with greater frequency to provide additional detail while having a more complete weather-climate record of attribution and prediction. In these discussions I adapt the GSDM for the warm season. Our list of work includes a seasonally adjusted rendition of the GSDM.
Western Hemisphere tropical SSTs remain generally above normal, with weekly mean anomalies ~ .5-1.0C. As a response to persistent tropical thunderstorm activity, SSTs have cooled ~120-140E along and north of the equator to the Southeast coast of Asia, with roughly minus 0.5C anomalies. There are still regions of warmth from the central Indian Ocean to western Indonesia as well as west of the date line. Actual tropical SSTs of 29C and warmer still cover most of the Eastern Hemisphere and also from the East Pacific into the Caribbean.
The downwelling oceanic Kelvin wave discussed in my last posting was located at about 170W based on the latest five-day averaged TAO data (link below). This feature was accompanied with SSTAs ~plus 1-2C down to at least 150m, and is the third oceanic Kelvin wave since mid-March (also fairly weak). A trade wind surge has developed across the central and eastern equatorial Pacific over the last 3-5 days, with easterly anomalies ~3 m/s just east of the date line (discussed below). These easterlies have led to some reduction of the anomalous warmth across the central Pacific. The westerly anomalies that had been present along the equator at the date line have propagated northwest (associated with tropical cyclones).
Additional global SST information can be obtained from latest TAO data here, ESRL/PSD data here, CPC data
http://www.cpc.ncep.noaa.gov/products/predictions/threats/index_gloss.html,
and BMRC at
http://www.bom.gov.au/bmrc/ocean/results/climocan.htm .
From continuous monitoring and various diagnostic and dynamical tools, there continues to be evidence that the weather-climate system is tilting toward a warm event. If a weak warm event has already emerged, the current trade wind surge discussed above will tend to dampen the positive SSTAs associated with it. However, the magnitude of any possible warm event and global impacts are unclear. The following are links to ENSO discussions.
http://www.cdc.noaa.gov/people/klaus.wolter/MEI/
http://www.cpc.ncep.noaa.gov/products/analysis_monitoring/enso_advisory/index.html
Please also see the following CPC link (and others therein) for further ENSO, etc., insights, and remember that official USA information on anything related to ENSO comes from CPC.
http://www.cpc.ncep.noaa.gov/products/predictions/90day/
Understanding the tropical convective forcing continues to be problematic. The 30-day mode of variability did come back around into the Eastern Hemisphere about 2-3 weeks ago and significantly enhanced the SST boundary forcing activity across the TNWP (a consolidation). Latest 3-day averages of OLR anomalies are ~ minus 70-90 W/m**2 centered ~10N/140E, with magnitudes of minus 30 W/m**2 and lower extending from north of New Zealand to the coast of South East Asia and into Japan. There are at least 3 tropical cyclones occurring across the TNWP at this time, including Super Typhoon Saomai (see http://www.npmoc.navy.mil/jtwc.html for details). This consolidation of tropical forcing has led to the trade wind surge mentioned above. Westerly wind anomalies of roughly 2-4m/s are still occurring along the equator from ~140-170E.
There is also the weak convectively coupled Kelvin wave propagating through central Africa into the central Indian Ocean. A local baroclinic response appears to be occurring with the feature, with, for instance, easterly wind anomalies of ~1-3m/s from 60-90E. Coherent modes Hovmollers suggest the TNWP convection to shift west as a Rossby mode (and this is already occurring) and consolidate with the convectively coupled Kelvin wave around 110E in about 3-5 days. Satellite pictures suggest this process may be already starting.
My own thought is for the Kelvin wave to consolidate with the activity downstream “anytime”, and maintain the intensity already present across the TNWP. I would also expect the Monsoon systems to regain their robustness. During weeks 2-3 at least some of the forcing should propagate into the Western Hemisphere (will this be much sooner??? -- satellite pictures already show the ITCZ convection is increasing).
Across the Western Hemisphere, there is some suppression with OLR anomalies ~ plus 30-50W/m**2 from the East Pacific into the Caribbean. The strong tropical wave approaching the Lesser Antilles is working against this suppression (please see http://www.nhc.noaa.gov/ for details of this feature and other tropical cyclone concerns).
Empirical, statistical and numerical prediction tools continue to be inconclusive for useful information about the future evolution of the tropical convection. Please see ESRL/PSD MJO tools , BMRC MJO tools, CPC MJO tools, and http://www.cpc.ncep.noaa.gov/products/precip/CWlink/MJO/index.primjo.html for the details. These tools generally rely on a moderate to strong MJO signal, which is nearly non-existent at this time. However, I think it is worthwhile to note that the Wheeler index has had a ~1 sigma signal for at least the last 2 days, centered on Southeast Asia and the TNWP (see link), not inconsistent with the above and tropical wind fields (discussed below). http://www.bom.gov.au/bmrc/clfor/cfstaff/matw/maproom/RMM/phase.Last90days.gif As already stated, an eastward propagating signal into the Western Hemisphere is likely to evolve, but should not project onto a MJO (recall my “wild card” scenario from a week ago).
Time-latitude sections of 200mb zonal mean zonal wind anomalies show anomalous westerly flow has increased from around 15S-30N, with magnitudes ~5m/s. Anomalous easterly flow replaced again by westerly flow (and so on) extends poleward into both hemispheres, with propagation (generate plots at http://www.cdc.noaa.gov/map/time_plot and see for yourself some of the details).
This distribution of zonal mean anomalies still has some symmetry to it, implying there is (and has been) important tropical forcing (even though there has been difficulty to diagnose the generally weak signals among the components). The recent increase of zonal mean anomalous westerly flow throughout the tropical and subtropical atmospheres discussed above can be partly attributed to the recent flare-up and consolidation of convective forcing across the TNWP.
If the interested reader does a time-latitude section of 200mb zonal averaged zonal wind anomalies from at least boreal spring, a relatively coherent poleward propagation of westerly anomalies starting about mid-June will be seen (see previous postings for details). Starting around mid-July into the present, zonal mean westerly anomalies of ~5-10m/s have been present from ~40-55N, north of easterly anomalies of similar magnitudes (part of the meridional symmetry). One can also think of this as poleward movement of atmospheric angular momentum. From that understanding, dynamically there would be an expectation of stronger than climatology subtropical ridges across the midlatitudes. This notion is consistent with recent observations, and has contributed to heat wave episodes across the USA and Europe.
Taking this thread one step farther, an argument may be offered that the above average 200mb westerly flow throughout the northern extratropics may be the result of enhanced north-south temperatures differences. If the interested reader also does a time-latitude section of zonal mean 500mb temperature anomalies (for example), loosely, warmer than average temperatures will generally be seen across polar latitudes with the reverse across the subtropics, with ~3-5C anomalies. Whatever the case may be (and however anybody wishes to do this calculation), a thermal wind justification cannot be made for this enhanced westerly flow. I would offer this additional westerly flow had a contribution from complex interactions involving recent well defined ~50-day mountain/frictional torque index cycle along with an intense version of the 30-day tropical forcing signal moving into the western Pacific, at that time. How much of a contribution that was and the details which were involved would be speculation. Some attention to this behavior may be given in the weather-climate discussion we are working on.
Once this additional westerly flow was able to interact with properly phased baroclinic wave packets (whatever that means), strong subtropical ridges became dominate across locations such as the USA and Europe leading to the intense heat. Was all this predictable??? The models did offer useful information and through monitoring I also captured some of this. However, that is as far as I will go.
Tropospheric global relative AAM is only slightly below normal based on the 1968-1997 reanalysis climatology through August 6th and the global torques are weak. The operational plot based on the 1979-1998 climatology shows AAM ~.5 sigma below normal. The AAM tendency was not available today; however, I think it is weakly negative since the global mountain torque is becoming negative. Lowering pressures along the east slopes of both the Andes and East Asian topography are likely contributing to a negative global mountain torque. I would expect the frictional torque to become positive soon given the increasing trades throughout Pacific and Indian Oceans (per above).
In a region of upper tropospheric divergence centered ~10N/130E (per animations of daily mean 150mb and 250mb vector wind anomalies), distorted twin subtropical anticyclones have been appearing in that area. These anticyclones are interacting with baroclinic wave packets from both hemispheres, and continue to properly phase these packets to support additional Pacific Northwest troughs and maintenance of a large subtropical anticyclone across the USA. Equatorial westerlies continue from about the date line into at least northern South America, with anomalies ~15-25m/s. These have become less coherent during the last couple of days. Why is that? Are these westerlies going to work around into the Eastern Hemisphere at some point, while propagating poleward and downward? Easterly anomalies continue throughout tropical Africa.
To summarize, I think we have a weather-climate situation consisting of 1) a consolidation of the 30-day tropical convective mode with the SST boundary forced tropical rainfall, 2) the weak convectively coupled Kelvin wave about to merge with (1) as the latter shifts west as a convectively coupled Rossby mode, 3) the mountain-frictional torque index cycle (loosely), 4) the rapid extratropical Rossby wave energy dispersions/baroclinic wave packets, 5) weak or non-existent MJO, 6) possible ENSO and/or global warming signal, and 7) the possibility of a convectively coupled signal propagating into the Western Hemisphere during ~weeks 1-3. We also need to start thinking about the role of the seasonal cycle (more) as transition to autumn approaches. I can list a lot of components within our GSDM framework; however, it still all adds up to a weak (if any) predictive signal.
GSDM Stage 1-2 best describes the current global circulation/weather-climate situation. Unlike what I have been thinking during the last couple of weeks, GSDM Stage 1-2 may persist roughly a week longer thanks to the Eastern Hemisphere tropical forcing shifting back to the west. Thus any retrogression of a ridge back to near the USA west coast looks to at least be delayed, perhaps unlikely. This goes back to the “wild card” scenario I was concerned about, minus the MJO. At least I was able to remain open minded about that possibility.
About the only signal I can go with is for the Eastern Hemisphere forcing to starting propagating into the Western Hemisphere as another 30-day mode, perhaps consisting of several Kelvin waves. A mature GSDM Stage 2 may be a reasonable option for weeks 2-3. Uncertainty remains tremendously high.
Week 1 (10-16 August 2006): GSDM Stage 1-2, seems probable. Per the NCEP GFS and other models, there look to be at least a few more mobile troughs to dig along the USA west coast, then move inland through the northern states. This would suggest additional episodes of heat to expand from the Central Rockies into much of the Central/Southern Plains and Deep South. An active severe local storm/MCS track would be possible from the Northern/Central Rockies into the Mid/Upper Mississippi Valley/Great Lakes-Ohio Valley. Other than the strong tropical wave cited above, the window of opportunity for North Atlantic tropical cyclone development may be closed. Please see http://www.nhc.noaa.gov/ for the latest tropical cyclone information.
Week 2 (17-23 August 2006): A continuation of week 1. However, even though the NCEP GFS model keeps the trough along or just off the USA west coast through week 2 (and the CDC ensemble is “different” – see links below), I think there is some possibility the trough will shift inland into the Rockies and eventually the Plains later this period or week 3. As already stated, this is different then my previous thoughts and I would not consider it statistically useful, only something to keep in mind. I am offering this based on a late summer going into fall rendition of GSDM Stage 2. This situation would bring cooler and wetter conditions to much of the Rockies and Plains, while the East and Deep South remain warm. Tropical cyclone development across the North Atlantic may become further suppressed, while the East Pacific may become active.
Week 3 (24-30 August 2006): See week 2.
Week 1 looks like a continuation of the same old warm/dry weather situation for Southwest Kansas. However, there look to be at least 2-3 energetic mobile troughs which will pass by to our north, dropping fronts into this region. As we have seen this summer, at least diurnally dependant storms will be scattered along these synoptic boundaries. It is just a matter of who gets the rain. If there is any truth about my week 2-3 options, cooler and wetter weather would be more probable here. Again, my forecast confidence is as low as it gets. Maybe an oracle or a wizard can help us see the weather future.
The time -filtered coherent modes Hovmoller plots of OLR and OLRA are at http://www.cdc.noaa.gov/map/clim/olr_modes/), velocity potential Hovmollers at http://www.cpc.ncep.noaa.gov/products/intraseasonal/vpot_tlon.html , and an animation of velocity potential overlayed on OLRAs are at http://www.cpc.ncep.noaa.gov/products/precip/CWlink/ir_anim_monthly.shtml.
Satellite imagery and other information can be found from the following links: eastern hemisphere, full-disk west Pacific, mtsat, IO, Africa, http://www.jma.go.jp/en/gms/ ; other imagery here. Latest tropical cyclone statements can be found from http://www.nhc.noaa.gov/, while the latest 3-day averages of OLR totals and anomalies and other data can be found here
http://www.cdc.noaa.gov/map/clim/glbcir.anim.shtml (animations of various fields from the operational data)
http://www.cpc.ncep.noaa.gov/products/precip/CWlink/MJO/mjo.shtml (Global Tropical Hazards Assessment available from this site, along with other useful information)
http://www.cdc.noaa.gov/map/clim/aam.rean.shtml (reanalysis AAM plots)
http://www.cdc.noaa.gov/map/clim/aam.shtml (operational AAM plots)
Latest CDC Ensemble Forecast
Latest NCEP Ensemble Forecast
Additional NCEP Ensemble Output
Latest Canadian Ensemble Output
Latest Deterministic ECMWF Forecasts
http://www.cdc.noaa.gov/people/jeffrey.s.whitaker/refcst/week2/
http://www.cdc.noaa.gov/MJO/Forecasts/climate_discussions.html (link to our Weather-
Climate discussions)
http://www.cpc.ncep.noaa.gov/schemm/z500ac_wk2_na.html (model performance; please navigate to others)
Please see the CPC Drought Monitor for areas of dryness and the latest official outlooks and statements from the Storm Prediction Center not only for severe storms, but also fire weather concerns. Finally, the CPC USA Hazards Assessment for offers additional insights not only for possible week 1 high impact weather, but week 2 as well.
I will try to do another posting this upcoming weekend. Work is also on-going to post a weather-climate discussion on the ESRL/PSD MJO web site hopefully by about the middle of this month (pushed back).
Ed Berry
http://www.cdc.noaa.gov/MJO/Predictions/wb2006.pdf
From taking into consideration the interactions of 4 different subseasonal time scales, a sequence of maps depicting a coherent set of repeatable events has been derived for the Northern Hemisphere cold season from November-March. This set is broken up into 4 stages, referred to as GSDM (for Global Synoptic-Dynamic Model) Stages 1-4 in the text of my Blog. Figure 13 in our paper presents a schematic of the GSDM. Ideally it would be advantageous to post our weather-climate discussions (link at the bottom) with greater frequency to provide additional detail while having a more complete weather-climate record of attribution and prediction. In these discussions I adapt the GSDM for the warm season. Our list of work includes a seasonally adjusted rendition of the GSDM.
Western Hemisphere tropical SSTs remain generally above normal, with weekly mean anomalies ~ .5-1.0C. As a response to persistent tropical thunderstorm activity, SSTs have cooled ~120-140E along and north of the equator to the Southeast coast of Asia, with roughly minus 0.5C anomalies. There are still regions of warmth from the central Indian Ocean to western Indonesia as well as west of the date line. Actual tropical SSTs of 29C and warmer still cover most of the Eastern Hemisphere and also from the East Pacific into the Caribbean.
The downwelling oceanic Kelvin wave discussed in my last posting was located at about 170W based on the latest five-day averaged TAO data (link below). This feature was accompanied with SSTAs ~plus 1-2C down to at least 150m, and is the third oceanic Kelvin wave since mid-March (also fairly weak). A trade wind surge has developed across the central and eastern equatorial Pacific over the last 3-5 days, with easterly anomalies ~3 m/s just east of the date line (discussed below). These easterlies have led to some reduction of the anomalous warmth across the central Pacific. The westerly anomalies that had been present along the equator at the date line have propagated northwest (associated with tropical cyclones).
Additional global SST information can be obtained from latest TAO data here, ESRL/PSD data here, CPC data
http://www.cpc.ncep.noaa.gov/products/predictions/threats/index_gloss.html,
and BMRC at
http://www.bom.gov.au/bmrc/ocean/results/climocan.htm .
From continuous monitoring and various diagnostic and dynamical tools, there continues to be evidence that the weather-climate system is tilting toward a warm event. If a weak warm event has already emerged, the current trade wind surge discussed above will tend to dampen the positive SSTAs associated with it. However, the magnitude of any possible warm event and global impacts are unclear. The following are links to ENSO discussions.
http://www.cdc.noaa.gov/people/klaus.wolter/MEI/
http://www.cpc.ncep.noaa.gov/products/analysis_monitoring/enso_advisory/index.html
Please also see the following CPC link (and others therein) for further ENSO, etc., insights, and remember that official USA information on anything related to ENSO comes from CPC.
http://www.cpc.ncep.noaa.gov/products/predictions/90day/
Understanding the tropical convective forcing continues to be problematic. The 30-day mode of variability did come back around into the Eastern Hemisphere about 2-3 weeks ago and significantly enhanced the SST boundary forcing activity across the TNWP (a consolidation). Latest 3-day averages of OLR anomalies are ~ minus 70-90 W/m**2 centered ~10N/140E, with magnitudes of minus 30 W/m**2 and lower extending from north of New Zealand to the coast of South East Asia and into Japan. There are at least 3 tropical cyclones occurring across the TNWP at this time, including Super Typhoon Saomai (see http://www.npmoc.navy.mil/jtwc.html for details). This consolidation of tropical forcing has led to the trade wind surge mentioned above. Westerly wind anomalies of roughly 2-4m/s are still occurring along the equator from ~140-170E.
There is also the weak convectively coupled Kelvin wave propagating through central Africa into the central Indian Ocean. A local baroclinic response appears to be occurring with the feature, with, for instance, easterly wind anomalies of ~1-3m/s from 60-90E. Coherent modes Hovmollers suggest the TNWP convection to shift west as a Rossby mode (and this is already occurring) and consolidate with the convectively coupled Kelvin wave around 110E in about 3-5 days. Satellite pictures suggest this process may be already starting.
My own thought is for the Kelvin wave to consolidate with the activity downstream “anytime”, and maintain the intensity already present across the TNWP. I would also expect the Monsoon systems to regain their robustness. During weeks 2-3 at least some of the forcing should propagate into the Western Hemisphere (will this be much sooner??? -- satellite pictures already show the ITCZ convection is increasing).
Across the Western Hemisphere, there is some suppression with OLR anomalies ~ plus 30-50W/m**2 from the East Pacific into the Caribbean. The strong tropical wave approaching the Lesser Antilles is working against this suppression (please see http://www.nhc.noaa.gov/ for details of this feature and other tropical cyclone concerns).
Empirical, statistical and numerical prediction tools continue to be inconclusive for useful information about the future evolution of the tropical convection. Please see ESRL/PSD MJO tools , BMRC MJO tools, CPC MJO tools, and http://www.cpc.ncep.noaa.gov/products/precip/CWlink/MJO/index.primjo.html for the details. These tools generally rely on a moderate to strong MJO signal, which is nearly non-existent at this time. However, I think it is worthwhile to note that the Wheeler index has had a ~1 sigma signal for at least the last 2 days, centered on Southeast Asia and the TNWP (see link), not inconsistent with the above and tropical wind fields (discussed below). http://www.bom.gov.au/bmrc/clfor/cfstaff/matw/maproom/RMM/phase.Last90days.gif As already stated, an eastward propagating signal into the Western Hemisphere is likely to evolve, but should not project onto a MJO (recall my “wild card” scenario from a week ago).
Time-latitude sections of 200mb zonal mean zonal wind anomalies show anomalous westerly flow has increased from around 15S-30N, with magnitudes ~5m/s. Anomalous easterly flow replaced again by westerly flow (and so on) extends poleward into both hemispheres, with propagation (generate plots at http://www.cdc.noaa.gov/map/time_plot and see for yourself some of the details).
This distribution of zonal mean anomalies still has some symmetry to it, implying there is (and has been) important tropical forcing (even though there has been difficulty to diagnose the generally weak signals among the components). The recent increase of zonal mean anomalous westerly flow throughout the tropical and subtropical atmospheres discussed above can be partly attributed to the recent flare-up and consolidation of convective forcing across the TNWP.
If the interested reader does a time-latitude section of 200mb zonal averaged zonal wind anomalies from at least boreal spring, a relatively coherent poleward propagation of westerly anomalies starting about mid-June will be seen (see previous postings for details). Starting around mid-July into the present, zonal mean westerly anomalies of ~5-10m/s have been present from ~40-55N, north of easterly anomalies of similar magnitudes (part of the meridional symmetry). One can also think of this as poleward movement of atmospheric angular momentum. From that understanding, dynamically there would be an expectation of stronger than climatology subtropical ridges across the midlatitudes. This notion is consistent with recent observations, and has contributed to heat wave episodes across the USA and Europe.
Taking this thread one step farther, an argument may be offered that the above average 200mb westerly flow throughout the northern extratropics may be the result of enhanced north-south temperatures differences. If the interested reader also does a time-latitude section of zonal mean 500mb temperature anomalies (for example), loosely, warmer than average temperatures will generally be seen across polar latitudes with the reverse across the subtropics, with ~3-5C anomalies. Whatever the case may be (and however anybody wishes to do this calculation), a thermal wind justification cannot be made for this enhanced westerly flow. I would offer this additional westerly flow had a contribution from complex interactions involving recent well defined ~50-day mountain/frictional torque index cycle along with an intense version of the 30-day tropical forcing signal moving into the western Pacific, at that time. How much of a contribution that was and the details which were involved would be speculation. Some attention to this behavior may be given in the weather-climate discussion we are working on.
Once this additional westerly flow was able to interact with properly phased baroclinic wave packets (whatever that means), strong subtropical ridges became dominate across locations such as the USA and Europe leading to the intense heat. Was all this predictable??? The models did offer useful information and through monitoring I also captured some of this. However, that is as far as I will go.
Tropospheric global relative AAM is only slightly below normal based on the 1968-1997 reanalysis climatology through August 6th and the global torques are weak. The operational plot based on the 1979-1998 climatology shows AAM ~.5 sigma below normal. The AAM tendency was not available today; however, I think it is weakly negative since the global mountain torque is becoming negative. Lowering pressures along the east slopes of both the Andes and East Asian topography are likely contributing to a negative global mountain torque. I would expect the frictional torque to become positive soon given the increasing trades throughout Pacific and Indian Oceans (per above).
In a region of upper tropospheric divergence centered ~10N/130E (per animations of daily mean 150mb and 250mb vector wind anomalies), distorted twin subtropical anticyclones have been appearing in that area. These anticyclones are interacting with baroclinic wave packets from both hemispheres, and continue to properly phase these packets to support additional Pacific Northwest troughs and maintenance of a large subtropical anticyclone across the USA. Equatorial westerlies continue from about the date line into at least northern South America, with anomalies ~15-25m/s. These have become less coherent during the last couple of days. Why is that? Are these westerlies going to work around into the Eastern Hemisphere at some point, while propagating poleward and downward? Easterly anomalies continue throughout tropical Africa.
To summarize, I think we have a weather-climate situation consisting of 1) a consolidation of the 30-day tropical convective mode with the SST boundary forced tropical rainfall, 2) the weak convectively coupled Kelvin wave about to merge with (1) as the latter shifts west as a convectively coupled Rossby mode, 3) the mountain-frictional torque index cycle (loosely), 4) the rapid extratropical Rossby wave energy dispersions/baroclinic wave packets, 5) weak or non-existent MJO, 6) possible ENSO and/or global warming signal, and 7) the possibility of a convectively coupled signal propagating into the Western Hemisphere during ~weeks 1-3. We also need to start thinking about the role of the seasonal cycle (more) as transition to autumn approaches. I can list a lot of components within our GSDM framework; however, it still all adds up to a weak (if any) predictive signal.
GSDM Stage 1-2 best describes the current global circulation/weather-climate situation. Unlike what I have been thinking during the last couple of weeks, GSDM Stage 1-2 may persist roughly a week longer thanks to the Eastern Hemisphere tropical forcing shifting back to the west. Thus any retrogression of a ridge back to near the USA west coast looks to at least be delayed, perhaps unlikely. This goes back to the “wild card” scenario I was concerned about, minus the MJO. At least I was able to remain open minded about that possibility.
About the only signal I can go with is for the Eastern Hemisphere forcing to starting propagating into the Western Hemisphere as another 30-day mode, perhaps consisting of several Kelvin waves. A mature GSDM Stage 2 may be a reasonable option for weeks 2-3. Uncertainty remains tremendously high.
Week 1 (10-16 August 2006): GSDM Stage 1-2, seems probable. Per the NCEP GFS and other models, there look to be at least a few more mobile troughs to dig along the USA west coast, then move inland through the northern states. This would suggest additional episodes of heat to expand from the Central Rockies into much of the Central/Southern Plains and Deep South. An active severe local storm/MCS track would be possible from the Northern/Central Rockies into the Mid/Upper Mississippi Valley/Great Lakes-Ohio Valley. Other than the strong tropical wave cited above, the window of opportunity for North Atlantic tropical cyclone development may be closed. Please see http://www.nhc.noaa.gov/ for the latest tropical cyclone information.
Week 2 (17-23 August 2006): A continuation of week 1. However, even though the NCEP GFS model keeps the trough along or just off the USA west coast through week 2 (and the CDC ensemble is “different” – see links below), I think there is some possibility the trough will shift inland into the Rockies and eventually the Plains later this period or week 3. As already stated, this is different then my previous thoughts and I would not consider it statistically useful, only something to keep in mind. I am offering this based on a late summer going into fall rendition of GSDM Stage 2. This situation would bring cooler and wetter conditions to much of the Rockies and Plains, while the East and Deep South remain warm. Tropical cyclone development across the North Atlantic may become further suppressed, while the East Pacific may become active.
Week 3 (24-30 August 2006): See week 2.
Week 1 looks like a continuation of the same old warm/dry weather situation for Southwest Kansas. However, there look to be at least 2-3 energetic mobile troughs which will pass by to our north, dropping fronts into this region. As we have seen this summer, at least diurnally dependant storms will be scattered along these synoptic boundaries. It is just a matter of who gets the rain. If there is any truth about my week 2-3 options, cooler and wetter weather would be more probable here. Again, my forecast confidence is as low as it gets. Maybe an oracle or a wizard can help us see the weather future.
The time -filtered coherent modes Hovmoller plots of OLR and OLRA are at http://www.cdc.noaa.gov/map/clim/olr_modes/), velocity potential Hovmollers at http://www.cpc.ncep.noaa.gov/products/intraseasonal/vpot_tlon.html , and an animation of velocity potential overlayed on OLRAs are at http://www.cpc.ncep.noaa.gov/products/precip/CWlink/ir_anim_monthly.shtml.
Satellite imagery and other information can be found from the following links: eastern hemisphere, full-disk west Pacific, mtsat, IO, Africa, http://www.jma.go.jp/en/gms/ ; other imagery here. Latest tropical cyclone statements can be found from http://www.nhc.noaa.gov/, while the latest 3-day averages of OLR totals and anomalies and other data can be found here
http://www.cdc.noaa.gov/map/clim/glbcir.anim.shtml (animations of various fields from the operational data)
http://www.cpc.ncep.noaa.gov/products/precip/CWlink/MJO/mjo.shtml (Global Tropical Hazards Assessment available from this site, along with other useful information)
http://www.cdc.noaa.gov/map/clim/aam.rean.shtml (reanalysis AAM plots)
http://www.cdc.noaa.gov/map/clim/aam.shtml (operational AAM plots)
Latest CDC Ensemble Forecast
Latest NCEP Ensemble Forecast
Additional NCEP Ensemble Output
Latest Canadian Ensemble Output
Latest Deterministic ECMWF Forecasts
http://www.cdc.noaa.gov/people/jeffrey.s.whitaker/refcst/week2/
http://www.cdc.noaa.gov/MJO/Forecasts/climate_discussions.html (link to our Weather-
Climate discussions)
http://www.cpc.ncep.noaa.gov/schemm/z500ac_wk2_na.html (model performance; please navigate to others)
Please see the CPC Drought Monitor for areas of dryness and the latest official outlooks and statements from the Storm Prediction Center not only for severe storms, but also fire weather concerns. Finally, the CPC USA Hazards Assessment for offers additional insights not only for possible week 1 high impact weather, but week 2 as well.
I will try to do another posting this upcoming weekend. Work is also on-going to post a weather-climate discussion on the ESRL/PSD MJO web site hopefully by about the middle of this month (pushed back).
Ed Berry
Saturday, August 05, 2006
Western Pacific "Explosion"
The following is a link to our recently accepted paper by MWR which discusses the GSDM (Weickmann and Berry 2006).
http://www.cdc.noaa.gov/MJO/Predictions/wb2006.pdf
From taking into consideration the interactions of 4 different subseasonal time scales, a sequence of maps depicting a coherent set of repeatable events has been derived for the Northern Hemisphere cold season from November-March. This set is broken up into 4 stages, referred to as GSDM (for Global Synoptic-Dynamic Model) Stages 1-4 in the text of my Blog. Figure 13 in our paper presents a schematic of the GSDM. Ideally it would be advantageous to post our weather-climate discussions (link at the bottom) with greater frequency to provide additional detail while having a more complete weather-climate record of attribution and prediction. In these discussions I adapt the GSDM for the warm season. Our list of work includes a seasonally adjusted rendition of the GSDM.
Global SSTs have changed little since the August 2nd posting. Oceanic Kelvin wave # 3 (since March 2006) continues its slow propagation along the equatorial cold tongue currently located ~165-170W per TAO data. Surface and low-level convergence has increased ~165E tied to the tropical forcing in that region, with easterly wind anomalies ~ 5m/s across the equatorial date line area. This is greatest anomalous easterly surface flow in this part of the world since late June. Global SST information can be obtained from latest TAO data here, ESRL/PSD data here, CPC data
http://www.cpc.ncep.noaa.gov/products/predictions/threats/index_gloss.html,
and BMRC at
http://www.bom.gov.au/bmrc/ocean/results/climocan.htm .
From continuous monitoring and various diagnostic and dynamical tools, there continues to be evidence that the weather-climate system is tilting toward a warm event. In fact, a weak warm event may have already emerged. However, the magnitude of any possible warm event and global impacts are unclear. The following are links to ENSO discussions.
http://www.cdc.noaa.gov/people/klaus.wolter/MEI/
http://www.cpc.ncep.noaa.gov/products/analysis_monitoring/enso_advisory/index.html
Please also see the following CPC link (and others therein) for further ENSO, etc., insights, and remember that official USA information on anything related to ENSO comes from CPC.
http://www.cpc.ncep.noaa.gov/products/predictions/90day/
A major purpose for me putting the effort to do these writings is emphasize the linkage weather and climate (within the GSDM framework). Hence I now feel the need to offer the following.
Since about the mid-1970s a region of the world oceans know as the warm pool (60e-170E, 15S-15N; see http://www.cdc.noaa.gov/ClimateIndices/List/#Pacificwarm for details; also see http://www.cdc.noaa.gov/ClimateIndices to generate time series of various indices) has been warming and expanding. After the 1997-98 strong El-Nino, the SSTs across the warm pool have remained generally above average with a trend to shift toward the date line. The point is I am beginning to think not only may there be an ENSO signal from that area, but perhaps a process operating on a slower time-scale arguably attributable to global warming.
Since I monitor the weather-climate situation daily, I think I can loosely defend the notion that MJO variability (~50 day recurrence time scale) has been less frequent during especially the past 5 years counting 2006 (noticeable after the 1997-98 warm event). What we have been observing with greater frequency is tropical convective variability having a ~30 day recurrent time scale. We have also been seeing at times persistent episodes of multiple regions of tropical forcing, with the western Pacific tending to dominate. Without going into any more detail, I would have to be suspicious that a slower term process may have modulated the MJO. This is just one issue of our research. Please see the following plot to get a sense of the above; understanding it is based on the 2 EOFs defining the time series.
http://www.bom.gov.au/bmrc/clfor/cfstaff/matw/maproom/RMM/ts.PCvar91drm.gif
I think the weather much of the country has experienced so far this summer has had a “direct” contribution from the slow process discussed above, including the devastating floods along the USA East Coast during late June (to be given attention in our next weather-climate discussion) and the on-going drought (multi-year for some) across the western and central sections. I can also attribute the periods of excessive heat to dynamic contributions from the western Pacific tropical convective forcing (working with other physical processes described by the GSDM).
Continuing from the August 2nd writing, I think there already has been a consolidation of the SST boundary forced tropical convection and the Eastern Hemisphere dynamical signal, centered ~ 10N/140E. Recent three-day averaged OLR anomalies of ~minus 50-70 W/m**2 have been observed along the equator around 150E (see link), with the general region of rainfall extending from Southeast Asia into the Southern Hemisphere east of the date line. Yes, Southern Hemisphere baroclinic wave activity is contributing. The TNWP has become quite active for tropical cyclone development (please see http://www.npmoc.navy.mil/jtwc.html for details). I expected this consolidation (with the enhancement of tropical cyclone activity) to occur, but not as soon. Finally, there is the weak dynamical signal (mostly a convectively coupled Kelvin wave) moving through central Africa about to emerge over the warm equatorial Indian Ocean SSTs. What is that going to do????? (recall the wild card scenario in the August 2nd writing).
http://www.bom.gov.au/bmrc/clfor/cfstaff/matw/maproom/OLR/m.3d.html
Empirical, statistical and numerical prediction tools continue to be inconclusive for useful information about the future evolution of the tropical convection, and that may go on until further notice. Please see ESRL/PSD MJO tools , BMRC MJO tools, CPC MJO tools, and http://www.cpc.ncep.noaa.gov/products/precip/CWlink/MJO/index.primjo.html for the details (and draw your own conclusions). These tools generally rely on a moderate to strong MJO signal, which is nearly non-existent at this time. I would like to think there would be at least some kind of respectable MJO during the upcoming Northern Hemisphere cold season following the seasonal cycle. We still have been seeing “some of that”.
Time-latitude sections of 200mb zonal mean zonal wind anomalies indicate there has been an increase in the westerly flow throughout the equatorial and north tropical atmospheres during ~ last 5-7 days. Zonal mean westerly anomalies are ~5m/s. Anomalous zonal mean easterlies continue around 35N and 25S, with westerlies on their poleward flanks (magnitudes generally 5-10m/s). The poleward flank westerly anomalies are believed to have resulted from meridional propagation of previously equatorial westerlies starting in June due to interactions with a mountain-frictional torque index cycle. This event contributed to the excessive East Coast rainfall and goes back to the linkage of a global warming signal with a synoptic event.
This distribution of zonal mean anomalies still has some symmetry to it, implying there is important tropical forcing (even though the signals are weak). The increase of zonal mean anomalous westerly flow across the tropics is attributable to the consolidation of the tropical forcing across the TNWP and particularly the equatorial flare-up around 150-160E.
Tropospheric global relative AAM is about minus 10 Hadleys based on the 1968-1997 reanalysis climatology through August 1st. The global (remember) mountain and frictional torques are ~ plus 15 and minus 10 Hadleys, respectively. The AAM tendency (which is the fundamental basis of our GSDM) has still not been updated; however, I think it is strongly positive. I believe this is so due to the global mountain torque and the rapid increase of upper tropospheric anomalous equatorial westerly flow during the last few days.
One contribution to the positive global mountain torque is from the East Asian topography. Recent baroclinic wave energy packets/fast Rossby wave energy dispersions interacting with the region of tropical convective forcing across the TNWP have been phased to favor positive mean sea level pressure anomalies along the east slopes of the East Asian north-south mountain barriers. Another contribution is starting to come from the Andes Mountains. For those who are astute on the GSDM and the Earth-Atmosphere AAM budget, there are “mixed signals”. For instance, if GSDM Stage 1 has best describes the recent global circulation, the global frictional torque should be positive. Recent anomalously low sea-level pressures across the tropics (along with a negative tropical mountain torque – that is a little better) have contributed to surface westerlies (including the western Pacific) across these areas, with additional contributions from Southern Hemisphere storm activity.
Upper tropospheric divergence has increased significantly across the Eastern Hemisphere centered ~120-130E just north of the equator. This is a direct response to the increased tropospheric heating due to the tropical convection in that region, at times forcing twin upper tropospheric anticyclones (above twin low-level cyclones – baroclinic mode). Equatorial and north tropical westerly wind anomalies are increasing from the date line into northern South America, with magnitudes ~15-25m/s (see plots for details). This westerly flow will help to suppress tropical cyclone development across the North Atlantic for ~ the next 1-2 weeks (hybrids understood).
To summarize, I think we have a weather-climate situation consisting of (for our purposes): 1) generally persistent SST boundary forced enhanced tropical convection across the western Pacific (global warming/ENSO signal?), 2) another dynamical signal of tropical convective forcing coming back around into Eastern Hemisphere from Africa, 3) the consolidation of the previous dynamical signal with (1), 4) a mountain-frictional torque index cycle, 5) rapid extratropical Rossby wave energy dispersions/baroclinic wave packets, and 6) weak or non-existent MJO. Even when all this is combined (linear super-position) any predictive signal is weak at best.
One behavior not on the list is the ~30 day mode of tropical forcing. If I have studied all the Hovmoller plots correctlyI can look at, my suspicion is (2) may be the “real” 30-day mode whereas the dynamical signal across the west Pacific may have been initiated by the Southern Hemisphere. This is in contrast to my last Blog. Whatever the case, this goes to show how weak individual components are and what a tremendous challenge it is to identify signal from literally mostly white noise.
GSDM Stage 1 still best describes the current global circulation/weather-climate situation. At some point I think it is probable the global circulation will transition to Stage 2; however, I am unclear to offer timing that would be useful. Uncertainty is very high, like it or not. The GSDM, numerical models, hybrid statistical/numerical models, etc. cannot do anything about that. Predictive information must be probabilistic.
Week 1 (6-12 August 2006): GSDM Stage 1, possibly transitioning to Stage 2, seems a reasonable option. There is good model agreement of retrogression of the intense USA ridge from the southeast states back into the central part of the country by early next week, then persisting. This would be consistent within the GSDM framework. The storm track should remain across the northern part of the country, meaning an active severe local storm/MCS track would be possible from the Northern/Central Rockies into the Mid/Upper Mississippi Valley/Great Lakes-Ohio Valley. I think we all know where the heat will be, by now. Tropical cyclone development across the North Atlantic looks to be suppressed. Please see http://www.nhc.noaa.gov/ for the latest tropical cyclone information.
Week 2 (13-19 August 2006): I am bravely going to stick with my notion from the last posting of a transition to GSDM Stage 2 possibly occurring in spite of the above, suggesting trough development may occur across the Great Lakes/eastern USA while ridge amplification occurs from initially the Great Basin into Alaska. After all, I am bound to get it right if I keep pushing it back a number of times. This synoptic pattern may retrograde going into week 3 (very optimistic!). A trend toward cooler/wetter for the Central and North Central states to at least New England, and a return to the intense heat for the western part of the country (depending on the ridge position) would be probable IF this happens. Only from initial condition information, the NCEP GFS ensemble offers some support to this option. Tropical cyclone development across the North Atlantic may remain suppressed.
Week 3 (20-26 August 2006): Unclear. During August 2004, before the 2004-05 warm event, GSDM Stage 2 was quite robust (please see our weather-climate discussions). Are we going to see that again??? I have concerns the ridge would remain across the Great Basin region, etc., instead of shifting back to ~130-140W with a ~100W trough, due to the warm pool issues.
About 3 months ago I maintained there was not much support from the weather-climate situation to support a “hot/dry” summer for Southwest Kansas. As far as I am concerned, that statement was a BIG BUST. I think the warm pool issues may have gotten the best of me. This has been a summer featuring stronger than normal subtropical ridges across particularly the western and central part of the country meaning periods of widespread beneficial rainfall have been much less likely. In fact, stronger than average western USA ridges have been a problem since ~summer 2000, and may be part of a longer-term signal linked to a warming western Pacific warm pool.
Understanding we could get a surprise event or 2 (and I hope so), the next three weeks still looks like a continuation of above normal temperatures and below normal rainfall for Southwest Kansas. At this point, anybody can make that statement and have the odds on their side to be “correct”. It may take the seasonal transition to fall to increase any opportunity for repeated widespread beneficial rainfall, understanding the climatology here (falls are generally dry). Perhaps we could get a window of opportunity between summer and fall for precipitation.
The time -filtered coherent modes Hovmoller plots of OLR and OLRA are at http://www.cdc.noaa.gov/map/clim/olr_modes/), velocity potential Hovmollers at http://www.cpc.ncep.noaa.gov/products/intraseasonal/vpot_tlon.html , and an animation of velocity potential overlayed on OLRAs are at http://www.cpc.ncep.noaa.gov/products/precip/CWlink/ir_anim_monthly.shtml.
Satellite imagery and other information can be found from the following links: eastern hemisphere, full-disk west Pacific, mtsat, IO, Africa, http://www.jma.go.jp/en/gms/ ; other imagery here. Latest tropical cyclone statements can be found from http://www.nhc.noaa.gov/, while the latest 3-day averages of OLR totals and anomalies and other data can be found here
http://www.cdc.noaa.gov/map/clim/glbcir.anim.shtml (animations of various fields from the operational data)
http://www.cpc.ncep.noaa.gov/products/precip/CWlink/MJO/mjo.shtml (Global Tropical Hazards Assessment available from this site, along with other useful information)
http://www.cdc.noaa.gov/map/images/sst/sst.long.time.gif (SST information going back to January 1982).
http://www.cdc.noaa.gov/cgi-bin/Composites/printpage.pl (composite on time series, etc.)
http://www.cdc.noaa.gov/map/clim/aam.rean.shtml (reanalysis AAM plots)
http://www.cdc.noaa.gov/map/clim/aam.shtml (operational AAM plots)
Latest CDC Ensemble Forecast
Latest NCEP Ensemble Forecast
Additional NCEP Ensemble Output
Latest Canadian Ensemble Output
Latest Deterministic ECMWF Forecasts
http://www.cdc.noaa.gov/people/jeffrey.s.whitaker/refcst/week2/
http://www.cdc.noaa.gov/MJO/Forecasts/climate_discussions.html (link to our Weather-
Climate discussions)
http://www.cpc.ncep.noaa.gov/schemm/z500ac_wk2_na.html (model performance; please navigate to others)
Please see the CPC Drought Monitor for areas of dryness and the latest official outlooks and statements from the Storm Prediction Center not only for severe storms, but also fire weather concerns. Finally, the CPC USA Hazards Assessment for offers additional insights not only for possible week 1 high impact weather, but week 2 as well.
I will try to do another posting about the middle of next week. Work is also on-going to post a weather-climate discussion on the ESRL/PSD MJO web site hopefully by about the middle of August (pushed back). I may have to postpone an update to this Blog next week to get a draft of the weather-climate discussion done.
Ed Berry
http://www.cdc.noaa.gov/MJO/Predictions/wb2006.pdf
From taking into consideration the interactions of 4 different subseasonal time scales, a sequence of maps depicting a coherent set of repeatable events has been derived for the Northern Hemisphere cold season from November-March. This set is broken up into 4 stages, referred to as GSDM (for Global Synoptic-Dynamic Model) Stages 1-4 in the text of my Blog. Figure 13 in our paper presents a schematic of the GSDM. Ideally it would be advantageous to post our weather-climate discussions (link at the bottom) with greater frequency to provide additional detail while having a more complete weather-climate record of attribution and prediction. In these discussions I adapt the GSDM for the warm season. Our list of work includes a seasonally adjusted rendition of the GSDM.
Global SSTs have changed little since the August 2nd posting. Oceanic Kelvin wave # 3 (since March 2006) continues its slow propagation along the equatorial cold tongue currently located ~165-170W per TAO data. Surface and low-level convergence has increased ~165E tied to the tropical forcing in that region, with easterly wind anomalies ~ 5m/s across the equatorial date line area. This is greatest anomalous easterly surface flow in this part of the world since late June. Global SST information can be obtained from latest TAO data here, ESRL/PSD data here, CPC data
http://www.cpc.ncep.noaa.gov/products/predictions/threats/index_gloss.html,
and BMRC at
http://www.bom.gov.au/bmrc/ocean/results/climocan.htm .
From continuous monitoring and various diagnostic and dynamical tools, there continues to be evidence that the weather-climate system is tilting toward a warm event. In fact, a weak warm event may have already emerged. However, the magnitude of any possible warm event and global impacts are unclear. The following are links to ENSO discussions.
http://www.cdc.noaa.gov/people/klaus.wolter/MEI/
http://www.cpc.ncep.noaa.gov/products/analysis_monitoring/enso_advisory/index.html
Please also see the following CPC link (and others therein) for further ENSO, etc., insights, and remember that official USA information on anything related to ENSO comes from CPC.
http://www.cpc.ncep.noaa.gov/products/predictions/90day/
A major purpose for me putting the effort to do these writings is emphasize the linkage weather and climate (within the GSDM framework). Hence I now feel the need to offer the following.
Since about the mid-1970s a region of the world oceans know as the warm pool (60e-170E, 15S-15N; see http://www.cdc.noaa.gov/ClimateIndices/List/#Pacificwarm for details; also see http://www.cdc.noaa.gov/ClimateIndices to generate time series of various indices) has been warming and expanding. After the 1997-98 strong El-Nino, the SSTs across the warm pool have remained generally above average with a trend to shift toward the date line. The point is I am beginning to think not only may there be an ENSO signal from that area, but perhaps a process operating on a slower time-scale arguably attributable to global warming.
Since I monitor the weather-climate situation daily, I think I can loosely defend the notion that MJO variability (~50 day recurrence time scale) has been less frequent during especially the past 5 years counting 2006 (noticeable after the 1997-98 warm event). What we have been observing with greater frequency is tropical convective variability having a ~30 day recurrent time scale. We have also been seeing at times persistent episodes of multiple regions of tropical forcing, with the western Pacific tending to dominate. Without going into any more detail, I would have to be suspicious that a slower term process may have modulated the MJO. This is just one issue of our research. Please see the following plot to get a sense of the above; understanding it is based on the 2 EOFs defining the time series.
http://www.bom.gov.au/bmrc/clfor/cfstaff/matw/maproom/RMM/ts.PCvar91drm.gif

I think the weather much of the country has experienced so far this summer has had a “direct” contribution from the slow process discussed above, including the devastating floods along the USA East Coast during late June (to be given attention in our next weather-climate discussion) and the on-going drought (multi-year for some) across the western and central sections. I can also attribute the periods of excessive heat to dynamic contributions from the western Pacific tropical convective forcing (working with other physical processes described by the GSDM).
Continuing from the August 2nd writing, I think there already has been a consolidation of the SST boundary forced tropical convection and the Eastern Hemisphere dynamical signal, centered ~ 10N/140E. Recent three-day averaged OLR anomalies of ~minus 50-70 W/m**2 have been observed along the equator around 150E (see link), with the general region of rainfall extending from Southeast Asia into the Southern Hemisphere east of the date line. Yes, Southern Hemisphere baroclinic wave activity is contributing. The TNWP has become quite active for tropical cyclone development (please see http://www.npmoc.navy.mil/jtwc.html for details). I expected this consolidation (with the enhancement of tropical cyclone activity) to occur, but not as soon. Finally, there is the weak dynamical signal (mostly a convectively coupled Kelvin wave) moving through central Africa about to emerge over the warm equatorial Indian Ocean SSTs. What is that going to do????? (recall the wild card scenario in the August 2nd writing).
http://www.bom.gov.au/bmrc/clfor/cfstaff/matw/maproom/OLR/m.3d.html
Empirical, statistical and numerical prediction tools continue to be inconclusive for useful information about the future evolution of the tropical convection, and that may go on until further notice. Please see ESRL/PSD MJO tools , BMRC MJO tools, CPC MJO tools, and http://www.cpc.ncep.noaa.gov/products/precip/CWlink/MJO/index.primjo.html for the details (and draw your own conclusions). These tools generally rely on a moderate to strong MJO signal, which is nearly non-existent at this time. I would like to think there would be at least some kind of respectable MJO during the upcoming Northern Hemisphere cold season following the seasonal cycle. We still have been seeing “some of that”.
Time-latitude sections of 200mb zonal mean zonal wind anomalies indicate there has been an increase in the westerly flow throughout the equatorial and north tropical atmospheres during ~ last 5-7 days. Zonal mean westerly anomalies are ~5m/s. Anomalous zonal mean easterlies continue around 35N and 25S, with westerlies on their poleward flanks (magnitudes generally 5-10m/s). The poleward flank westerly anomalies are believed to have resulted from meridional propagation of previously equatorial westerlies starting in June due to interactions with a mountain-frictional torque index cycle. This event contributed to the excessive East Coast rainfall and goes back to the linkage of a global warming signal with a synoptic event.
This distribution of zonal mean anomalies still has some symmetry to it, implying there is important tropical forcing (even though the signals are weak). The increase of zonal mean anomalous westerly flow across the tropics is attributable to the consolidation of the tropical forcing across the TNWP and particularly the equatorial flare-up around 150-160E.
Tropospheric global relative AAM is about minus 10 Hadleys based on the 1968-1997 reanalysis climatology through August 1st. The global (remember) mountain and frictional torques are ~ plus 15 and minus 10 Hadleys, respectively. The AAM tendency (which is the fundamental basis of our GSDM) has still not been updated; however, I think it is strongly positive. I believe this is so due to the global mountain torque and the rapid increase of upper tropospheric anomalous equatorial westerly flow during the last few days.
One contribution to the positive global mountain torque is from the East Asian topography. Recent baroclinic wave energy packets/fast Rossby wave energy dispersions interacting with the region of tropical convective forcing across the TNWP have been phased to favor positive mean sea level pressure anomalies along the east slopes of the East Asian north-south mountain barriers. Another contribution is starting to come from the Andes Mountains. For those who are astute on the GSDM and the Earth-Atmosphere AAM budget, there are “mixed signals”. For instance, if GSDM Stage 1 has best describes the recent global circulation, the global frictional torque should be positive. Recent anomalously low sea-level pressures across the tropics (along with a negative tropical mountain torque – that is a little better) have contributed to surface westerlies (including the western Pacific) across these areas, with additional contributions from Southern Hemisphere storm activity.
Upper tropospheric divergence has increased significantly across the Eastern Hemisphere centered ~120-130E just north of the equator. This is a direct response to the increased tropospheric heating due to the tropical convection in that region, at times forcing twin upper tropospheric anticyclones (above twin low-level cyclones – baroclinic mode). Equatorial and north tropical westerly wind anomalies are increasing from the date line into northern South America, with magnitudes ~15-25m/s (see plots for details). This westerly flow will help to suppress tropical cyclone development across the North Atlantic for ~ the next 1-2 weeks (hybrids understood).
To summarize, I think we have a weather-climate situation consisting of (for our purposes): 1) generally persistent SST boundary forced enhanced tropical convection across the western Pacific (global warming/ENSO signal?), 2) another dynamical signal of tropical convective forcing coming back around into Eastern Hemisphere from Africa, 3) the consolidation of the previous dynamical signal with (1), 4) a mountain-frictional torque index cycle, 5) rapid extratropical Rossby wave energy dispersions/baroclinic wave packets, and 6) weak or non-existent MJO. Even when all this is combined (linear super-position) any predictive signal is weak at best.
One behavior not on the list is the ~30 day mode of tropical forcing. If I have studied all the Hovmoller plots correctlyI can look at, my suspicion is (2) may be the “real” 30-day mode whereas the dynamical signal across the west Pacific may have been initiated by the Southern Hemisphere. This is in contrast to my last Blog. Whatever the case, this goes to show how weak individual components are and what a tremendous challenge it is to identify signal from literally mostly white noise.
GSDM Stage 1 still best describes the current global circulation/weather-climate situation. At some point I think it is probable the global circulation will transition to Stage 2; however, I am unclear to offer timing that would be useful. Uncertainty is very high, like it or not. The GSDM, numerical models, hybrid statistical/numerical models, etc. cannot do anything about that. Predictive information must be probabilistic.
Week 1 (6-12 August 2006): GSDM Stage 1, possibly transitioning to Stage 2, seems a reasonable option. There is good model agreement of retrogression of the intense USA ridge from the southeast states back into the central part of the country by early next week, then persisting. This would be consistent within the GSDM framework. The storm track should remain across the northern part of the country, meaning an active severe local storm/MCS track would be possible from the Northern/Central Rockies into the Mid/Upper Mississippi Valley/Great Lakes-Ohio Valley. I think we all know where the heat will be, by now. Tropical cyclone development across the North Atlantic looks to be suppressed. Please see http://www.nhc.noaa.gov/ for the latest tropical cyclone information.
Week 2 (13-19 August 2006): I am bravely going to stick with my notion from the last posting of a transition to GSDM Stage 2 possibly occurring in spite of the above, suggesting trough development may occur across the Great Lakes/eastern USA while ridge amplification occurs from initially the Great Basin into Alaska. After all, I am bound to get it right if I keep pushing it back a number of times. This synoptic pattern may retrograde going into week 3 (very optimistic!). A trend toward cooler/wetter for the Central and North Central states to at least New England, and a return to the intense heat for the western part of the country (depending on the ridge position) would be probable IF this happens. Only from initial condition information, the NCEP GFS ensemble offers some support to this option. Tropical cyclone development across the North Atlantic may remain suppressed.
Week 3 (20-26 August 2006): Unclear. During August 2004, before the 2004-05 warm event, GSDM Stage 2 was quite robust (please see our weather-climate discussions). Are we going to see that again??? I have concerns the ridge would remain across the Great Basin region, etc., instead of shifting back to ~130-140W with a ~100W trough, due to the warm pool issues.
About 3 months ago I maintained there was not much support from the weather-climate situation to support a “hot/dry” summer for Southwest Kansas. As far as I am concerned, that statement was a BIG BUST. I think the warm pool issues may have gotten the best of me. This has been a summer featuring stronger than normal subtropical ridges across particularly the western and central part of the country meaning periods of widespread beneficial rainfall have been much less likely. In fact, stronger than average western USA ridges have been a problem since ~summer 2000, and may be part of a longer-term signal linked to a warming western Pacific warm pool.
Understanding we could get a surprise event or 2 (and I hope so), the next three weeks still looks like a continuation of above normal temperatures and below normal rainfall for Southwest Kansas. At this point, anybody can make that statement and have the odds on their side to be “correct”. It may take the seasonal transition to fall to increase any opportunity for repeated widespread beneficial rainfall, understanding the climatology here (falls are generally dry). Perhaps we could get a window of opportunity between summer and fall for precipitation.
The time -filtered coherent modes Hovmoller plots of OLR and OLRA are at http://www.cdc.noaa.gov/map/clim/olr_modes/), velocity potential Hovmollers at http://www.cpc.ncep.noaa.gov/products/intraseasonal/vpot_tlon.html , and an animation of velocity potential overlayed on OLRAs are at http://www.cpc.ncep.noaa.gov/products/precip/CWlink/ir_anim_monthly.shtml.
Satellite imagery and other information can be found from the following links: eastern hemisphere, full-disk west Pacific, mtsat, IO, Africa, http://www.jma.go.jp/en/gms/ ; other imagery here. Latest tropical cyclone statements can be found from http://www.nhc.noaa.gov/, while the latest 3-day averages of OLR totals and anomalies and other data can be found here
http://www.cdc.noaa.gov/map/clim/glbcir.anim.shtml (animations of various fields from the operational data)
http://www.cpc.ncep.noaa.gov/products/precip/CWlink/MJO/mjo.shtml (Global Tropical Hazards Assessment available from this site, along with other useful information)
http://www.cdc.noaa.gov/map/images/sst/sst.long.time.gif (SST information going back to January 1982).
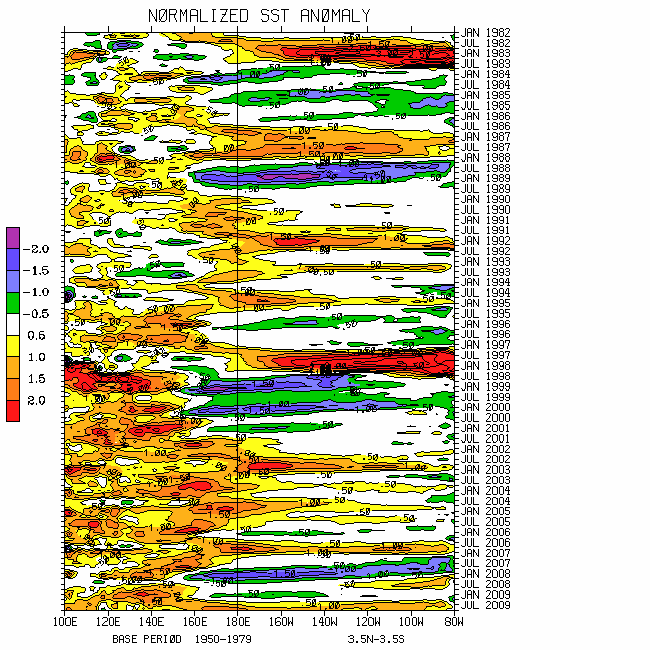
http://www.cdc.noaa.gov/cgi-bin/Composites/printpage.pl (composite on time series, etc.)
http://www.cdc.noaa.gov/map/clim/aam.rean.shtml (reanalysis AAM plots)
http://www.cdc.noaa.gov/map/clim/aam.shtml (operational AAM plots)
Latest CDC Ensemble Forecast
Latest NCEP Ensemble Forecast
Additional NCEP Ensemble Output
Latest Canadian Ensemble Output
Latest Deterministic ECMWF Forecasts
http://www.cdc.noaa.gov/people/jeffrey.s.whitaker/refcst/week2/
http://www.cdc.noaa.gov/MJO/Forecasts/climate_discussions.html (link to our Weather-
Climate discussions)
http://www.cpc.ncep.noaa.gov/schemm/z500ac_wk2_na.html (model performance; please navigate to others)
Please see the CPC Drought Monitor for areas of dryness and the latest official outlooks and statements from the Storm Prediction Center not only for severe storms, but also fire weather concerns. Finally, the CPC USA Hazards Assessment for offers additional insights not only for possible week 1 high impact weather, but week 2 as well.
I will try to do another posting about the middle of next week. Work is also on-going to post a weather-climate discussion on the ESRL/PSD MJO web site hopefully by about the middle of August (pushed back). I may have to postpone an update to this Blog next week to get a draft of the weather-climate discussion done.
Ed Berry
Subscribe to:
Posts (Atom)